Designing a Scorecard for Sustainability: Facilitator Notes
AHRQ Safety Program for Surgery
Slide 1: Sustaining and Spreading Surgical Safety Improvements
Say:
The module covers how to design a scorecard for sustaining your surgical improvement efforts.
Slide 2: Learning Objectives
Say:
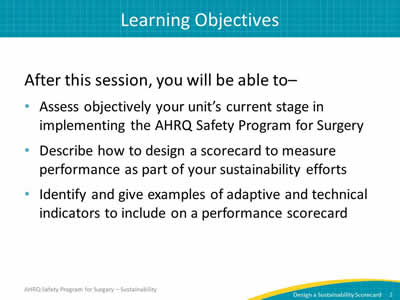
After this session, you will be able assess objectively your unit’s current stage in surgical quality implementation, describe how to design a scorecard to measure performance as a part of your sustainability efforts, and identify and give examples of adaptive and technical indicators to include on a performance scorecard.
Today we will review a scorecard. A scorecard allows you to gauge your teams’ progress on the project and identify points where attention is needed.
Your team enters the surgery ward every day intending to provide good care. We don’t always get the time to reflect on team performance. Scorecards help teams figure out whether activities have or have not been done as expected. They also help your team determine what is going well and identify areas for improvement.
Slide 3: Action Plan
Say:
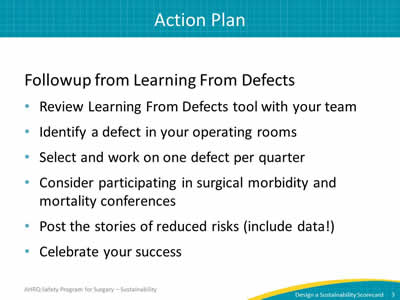
This module follows up on the previous conversations about learning from defects. When the Learning From Defects tool was shared from the perspective of sustainability, teams were instructed to focus on learning from mistakes and problem solving at a deeper level.
The recommendation is to learn from at least one defect per quarter. Once your team has a few wins, consider participating in surgical conferences. Post the stories of the reduced risks, along with your data within your hospital network. Share stories of how defects were identified and what was learned from them. Celebrate successes with your teams.
Slide 4: Checking Your Progress
Say:
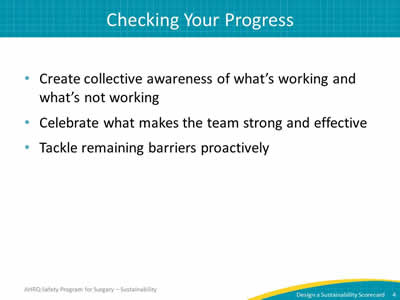
It’s important to take stock and check your progress. Strive to create collective awareness of team progress. Positive reinforcement is integrated by celebrating the things that are going well and what makes your team strong and effective. Tackle any remaining barriers or any barriers as they come up proactively rather than reactively.
Slide 5: Scorecard Parameters
Say:
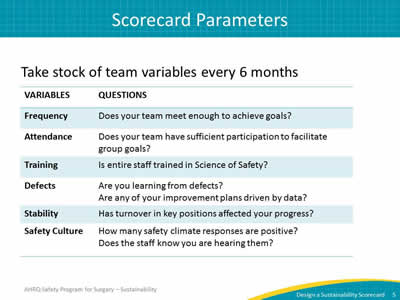
Now let’s discuss some ideas about what to include in your scorecard. Rather than provide an established scorecard template, we recommend a flexible model with room for local customization.
As a starting point, we have listed some variables that are good indicators of long-term performance.
Ask:
How frequently are you meeting?
Say:
If your quality improvement team is no longer meeting regularly, it is difficult to achieve goals. If your team has lost momentum, consider revisiting your meeting schedule.
Ask:
Does your team have sufficient participation to facilitate your group goals?
Say:
The attendance patterns of specific participants in your team meetings can indicate team activity as well. If your surgeon champion rarely attends meetings, it may be difficult to meet surgeon needs and garner buy-in of other surgeons.
Ask:
How much of the staff has been trained in the Science of Safety?
Are you learning from each defect?
Are you keeping tabs on identified defects?
Is there a feedback loop for sharing progress on quality work?
Is staff turnover impacting your progress?
Say:
The last item covers safety culture. Though safety culture requires longer periods of time to change, pause to reflect on progress with data.
Ask:
How many safety climate responses are positive?
Does the staff know their concerns are being heard?
What is your response rate on safety culture assessments?
Slide 6: Sustainability Scorecard
Say:
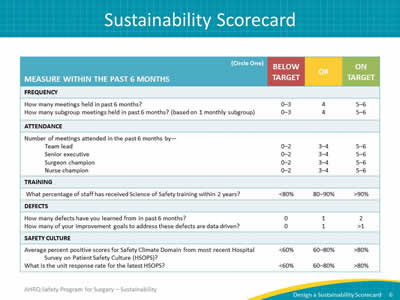
This template presents some previously mentioned scorecard elements. As you create your scorecard, these categories may be useful.
The topic questions have been worded to fit a consistent schema: on target, OK, or below target. The score for each element indicates whether your team is above or below the desired goal. It signals where your team receives passing marks and where improvements are needed.
After you have recorded the number of team meetings held in the last 6 months, the dashboard columns score the results: Anything less than four is below target, maybe four in the last 6 months is OK, and five or six indicates you are on target.
Keep in mind that this is a guideline. For instance, colleagues impacted by harsh winter conditions may have been unable to attend some meetings. Regardless of circumstances, assessing the frequency of meetings provides an indicator for the health of your team.
Customize your scorecard to reflect your subgroup meetings as well. Several teams have reported two groups, such as preoperative and postoperative groups. Recognize both how many subgroups meet and how often they are expected to meet on your scorecard.
The attendance questions ask who and how frequently specific team members attend meetings. Attendance and engagement are critical to success; perhaps an honest assessment about team member engagement will help determine if your team is optimally staffed.
Please note that senior executive attendance matters. A deputized stand-in is not a viable replacement for senior leadership engagement and consistent participation.
Ask:
In addition to the senior executive, how many meetings did your surgeon champion attend in the last 6 months?
And your nurse champion?
Say:
Tailor your scorecard to fit your team members. For example, you can add other prominent roles represented on your safety team, like an infection control nurse.
Overall, the scorecard should help you reflect on the last 6 months. Design one that you can do collectively with your team every 6 months and assess a self-rating score on the health of your team.
For training, the Science of Safety training is the premier component of staff exposure to your team’s work efforts. Target at least 80 percent of staff to have viewed Science of Safety training within the last two years. Anything below 80 percent is below target. This is an example of a signal to determine how to get all staff members aware and involved.
Ask:
Have you embedded Science of Safety in onboarding or orientation programs for all new staff, including physicians?
Say:
Next, consider the defects that your team has addressed in the last 6 months. This section is intentionally ambiguous because defects come in a wide range of complexity. Some defects are quite simple to solve, while others could be as complex as a sentinel event requiring organization-level interventions.
Ask:
How many defects have you learned from in the past 6 months?
Say:
Each team should learn from at least one defect per quarter, including addressing contributing factors with interventions. It would be even better if your team has three defects solved in a quarter.
Ask:
How many of your improvement goals to address defects are data driven?
Some defects may not have data associated with them, but generally, the majority of defects do have supporting data. Present that data to the frontline providers and anyone impacted in those defects.
For safety culture assessments, review your average percent safety score. An acceptable target range is 60 percent to 80 percent, and scores greater than 80 percent are excellent. But anything below 60 percent indicates a red flag. Examine the low scoring domains to determine what is happening in that clinical area.
Ask:
For local safety culture, what is the unit response rate? Or what percentage of staff members completed safety culture surveys?
Say:
The higher the unit response rate is, the more representative the safety scores are to that clinical area. We often find that physicians complete fewer surveys than those in other job roles. If you find a role underrepresented in the survey, plan how to engage those groups in completing the survey.
Slide 7: Sustainability Scorecard
Say:
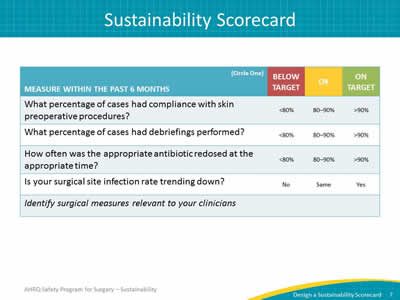
The second page provides an opportunity to evaluate process and outcome indicators for your clinical setting. A few surgery-related indicators are also listed. Include indicators that would be applicable and relevant to your frontline clinicians.
Slide 8: Keeping an Eye on Culture
Say:
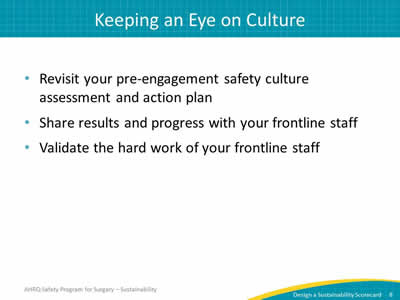
Be aware of local performance using data, including understanding your most current safety culture responses and trends.
If you administer a culture survey to your staff regularly, use the comparative data points to recognize growth. Debrief the results with frontline staff and unit leadership. Use the safety culture improvements to validate the work efforts of your frontline staff.
Slide 9: Nurture Your Safety Culture
Say:
Throughout most of his life, 19th-century French chemist Louis Pasteur insisted that germs were the cause of disease, not the body. It wasn't until Pasteur was nearing the end of his life, having suffered multiple strokes before contracting pneumonia, that he reversed his perspective on the environment of the infection, reportedly saying, "It is the soil, not the seed."
In other words, a germ (the seed) causes disease when our bodies (the soil) provide a hospitable environment. In patient safety, the quality of the environment (the safety culture) greatly influences the safety of patient care.
Nurture the safety culture; it is the environment for every interaction and intervention.


