NQS Priority: Patient Safety
Postoperative Sepsis
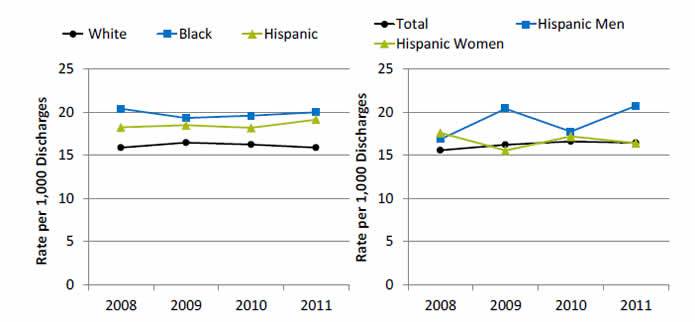
Postoperative sepsis per 1,000 adult discharges with an elective operating room procedure, by race/ethnicity and among Hispanics, by sex, 2008-2011

Left Graph:
| Year | White | Hispanic | Black |
|---|---|---|---|
| 2008 | 15.9 | 18.2 | 20.4 |
| 2009 | 16.4 | 18.5 | 19.3 |
| 2010 | 16.2 | 18.2 | 19.6 |
| 2011 | 15.9 | 19.1 | 20.0 |
Right Graph:
| Year | Total | Hispanic Men | Hispanic Women |
|---|---|---|---|
| 2008 | 15.6 | 16.8 | 17.6 |
| 2009 | 16.2 | 20.4 | 15.5 |
| 2010 | 16.6 | 17.7 | 17.2 |
| 2011 | 16.4 | 20.7 | 16.4 |
Source: Agency for Healthcare Research and Quality (AHRQ), Healthcare Cost and Utilization Project, State Inpatient Databases, 2008‐2011 disparities analysis files; 2008‐2011 Nationwide Inpatient Sample; and AHRQ Quality Indicators, modified version 4.4.
Denominator: All elective hospital surgical discharges for patients age 18 years and over with length of stay of 4 or more days, excluding patients admitted for infection, those with cancer or immunocompromised states, those with obstetric conditions, and admissions specifically for sepsis.
Note: Acute care hospitalizations only. For this measure, lower rates are better. Rates are adjusted by age, sex, age-sex interactions, comorbidities, major diagnostic category, diagnosis-related group , and transfers into the hospital.
- Overall Rate: In 2011, the postoperative sepsis rate was 16.4 per 1,000 adult discharges with an elective operating room procedure.
- Trends: From 2008 through 2011, there were no statistically significant changes overall or for any ethnic group in the rate of postoperative sepsis.
- Groups With Disparities:
- In all years, Hispanic patients and Black patients had higher rates of postoperative sepsis than their White counterparts.
- In 2009 and 2011, Hispanic men had higher rates of postoperative sepsis than Hispanic women.
Postoperative Sepsis, by Patient Language
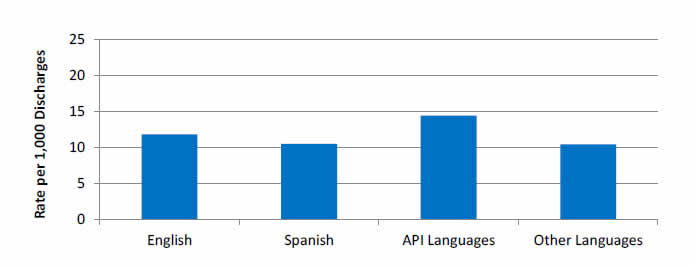
Postoperative sepsis per 1,000 adult discharges with an elective operating room procedure, by patient language, California, 2009-2011 (combined)

Key: API = Asian and Pacific Islander; languages include Chinese, Hindi, Japanese, Korean, Tagalog, Thai, Vietnamese, Lao, Mandarin, Cantonese, Hmong, Ilocano, Iu Mien, Indonesian, Mon-Khmer, Tonga, Urdu, Burmese, Telugu, Bengali, Tamil, Gujarati, Panjabi, Malayalam, Marathi, Kannada, Chamorro, Fijian, Filipino, Central Khmer, Mongolian, Nepali, Sinhala, and Samoan.
Source: Agency for Healthcare Research and Quality (AHRQ), Healthcare Cost and Utilization Project, State Inpatient Databases, California, 2009-2011, and AHRQ Quality Indicators, version 4.5 with the use of indication of diagnoses being present on admission and day of procedure.
Denominator: All elective hospital surgical discharges for patients age 18 years and over with length of stay of 4 or more days, excluding patients admitted for infection, those with cancer or immunocompromised states, those with obstetric conditions, and admissions specifically for sepsis.
Note: Acute care hospitalizations only. For this measure, lower rates are better. Rates are adjusted by age, sex, age-sex interactions, comorbidities, major diagnostic category, diagnosis-related group, and transfers into the hospital.
- Groups With Disparities: From January 2009 through December 2011 combined, there were no statistically significant differences by language spoken in rates of postoperative sepsis.
Use of Restraints in Nursing Homes
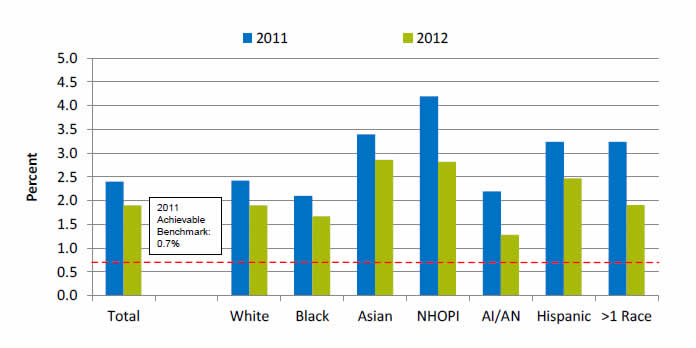
Long-stay nursing home residents experiencing use of restraints, by race/ethnicity, 2011-2012

| Race/Ethnicity | 2011 | 2012 |
|---|---|---|
| Total | 2.4 | 1.9 |
| White | 2.4 | 1.9 |
| Black | 2.1 | 1.7 |
| Asian | 3.4 | 2.9 |
| NHOPI | 4.2 | 2.8 |
| AI/AN | 2.2 | 1.3 |
| Hispanic | 3.2 | 2.5 |
| >1 Race | 3.2 | 1.9 |
2011 Achievable Benchmark: 0.7%.
Key: NHOPI = Native Hawaiian or Other Pacific Islander; AI/AN = American Indian or Alaska Native.
Source: Centers for Medicare & Medicaid Services, Minimum Data Set 3.0, 2014.
Denominator: Long-stay residents, who are defined as having a cumulative stay greater than 100 days.
Note: For this measure, lower rates are better.
- Importance: Residents who are restrained daily can become weak, lose their ability to go to the bathroom by themselves, and develop pressure ulcers or other medical conditions.
- Overall Rate: In 2012, the percentage of long-stay nursing home residents who were physically restrained on a daily basis was 1.9%.
- Groups With Disparities:
- In 2012, Asians, Native Hawaiians and Other Pacific Islanders, and Hispanics had higher rates of daily restraint use compared with Whites.
- Blacks and American Indians and Alaska Natives had lower rates of daily restraint use compared with Whites.
- Achievable Benchmark:
- In 2011, the top 5 State achievable benchmark for restraint use was 0.7%. The States that contributed to the achievable benchmark are Kansas, Maine, Nebraska, New Hampshire, and Vermont.
- No group has achieved the benchmark.
Return to National Quality Strategy Priorities
Return to Contents


