This part of the chartbook focuses on health care of residents on the U.S. side of the U.S.-Mexico border. In future, we will seek to add information about the Mexico side of the border.
U.S.-Mexico Border Region
- U.S.-Mexico border region exists within:
- 100 km (62.2 miles) of the international boundary.
- U.S. States of California, Arizona, New Mexico, and Texas.
- Mexican States of Baja California, Sonora, Chihuahua, Coahuila, Nuevo Leon, and Tamaulipas.
- U.S.-Mexico Border Health Commission focuses on border health and creates a venue to address public health along the border.
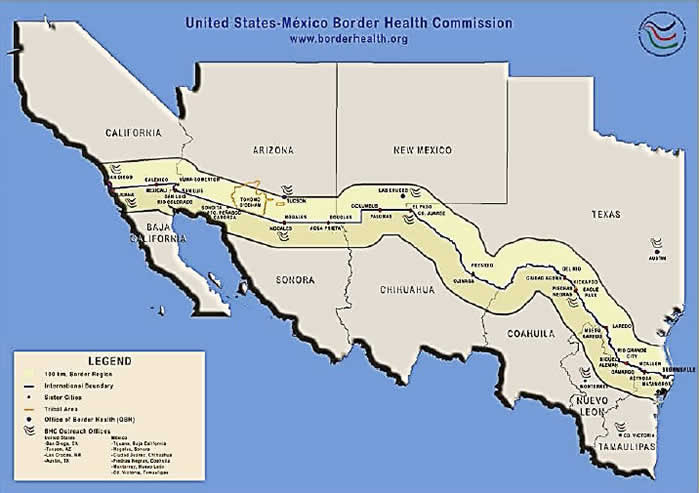
Source: http://www.globalhealth.gov/world-regions/americas/us-mexico-border-health/
Border Health Priorities
- Border health priorities include:
- Access to health care.
- Cancer.
- Environmental health.
- HIV/AIDS.
- Immunizations and infectious diseases.
- Injury prevention.
- Maternal and child health.
- Mental health.
- Oral health.
- Respiratory diseases.
Source: http://www.globalhealth.gov/world-regions/americas/us-mexico-border-health/
Health Care Quality in Border States
Quality Scores
Quality Scores in U.S. Border States
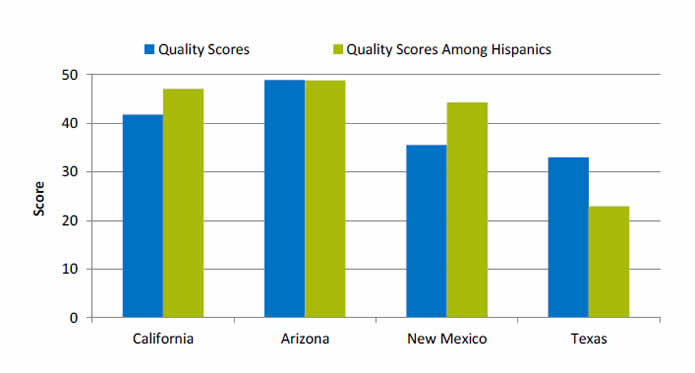
Source: AHRQ State Snapshots 2014. http://nhqrnet.ahrq.gov/inhqrdr/state/select.
- Methods:
- An overall quality score is computed for each State based on the number of quality measures that are above, at, or below the average across all States; the median score is typically around 50. A quality score for Hispanics is computed in a similar manner but only using data for Hispanics. Go to State Snapshots at http://nhqrnet.ahrq.gov/inhqrdr/state/select for more detailed methods.
- Geographic Variation:
- There was significant variation in overall quality among U.S. States on the border. Arizona and California are close to the median while New Mexico and Texas are far from the median, ranking 48 and 49, respectively, out of the 50 States and the District of Columbia.
- In terms of quality of care received by Hispanics, there was also significant variation among U.S. States on the border. Arizona, California, and New Mexico are close to the median while Texas ranks last out of the 50 States and the District of Columbia.
- The State Snapshots tool (http://nhqrnet.ahrq.gov/inhqrdr/state/select), part of the QDR Web site, focuses on variation across States and helps State health leaders, researchers, and consumers understand the status of health care in individual States and the District of Columbia. It is based on more than 100 QDR measures for which State estimates are possible.
Quality Scores by National Quality Strategy Priority
Quality Scores in Border States by National Quality Strategy Priority
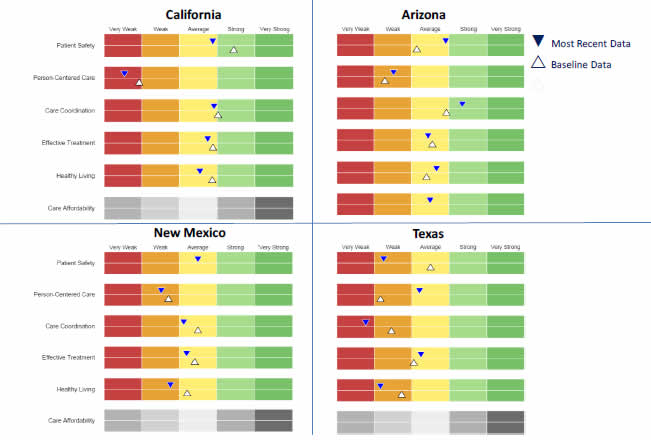
Source: AHRQ State Snapshots 2014. http://nhqrnet.ahrq.gov/inhqrdr/state/select.
- Geographic Variation:
- Border States vary in the quality of care delivered in different priority areas of the National Quality Strategy. An overall quality score is computed for each State based on the number of quality measures that are above, at, or below the average across all States; the median score is typically around 50 and is shown as the middle of the yellow band above.
- California, Arizona, and New Mexico are weak in person-centered care. New Mexico and Texas are weak in healthy living. Texas is also weak in patient safety and care coordination. Data are limited for assessing care affordability in most States.
- Arizona is strong in care coordination.
Quality Scores by Condition
Quality Scores in Border States by Condition
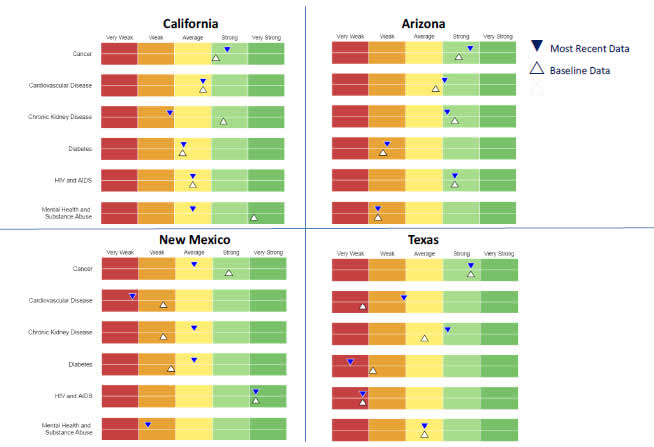
Source: AHRQ State Snapshots 2014. http://nhqrnet.ahrq.gov/inhqrdr/state/select.
- Geographic Variation:
- Border States vary in the quality of care delivered for different conditions. An overall quality score is computed for each State based on the number of quality measures that are above, at, or below the average across all States; the median score is typically around 50 and is shown as the middle of the yellow band above.
- California is weak in care for chronic kidney disease. Arizona and Texas are weak in care for diabetes. Arizona and New Mexico are weak in care for mental health and substance abuse. New Mexico and Texas are weak in care for cardiovascular disease. Texas is also weak in care for HIV and AIDS.
- California, Arizona, and Texas are strong in care for cancer. Arizona and New Mexico are strong in care for HIV and AIDS. Arizona and Texas are strong in care for chronic kidney disease. Arizona is also strong in care for cardiovascular disease.
Quality Scores by Type of Care
Quality Scores in Border States by Type of Care
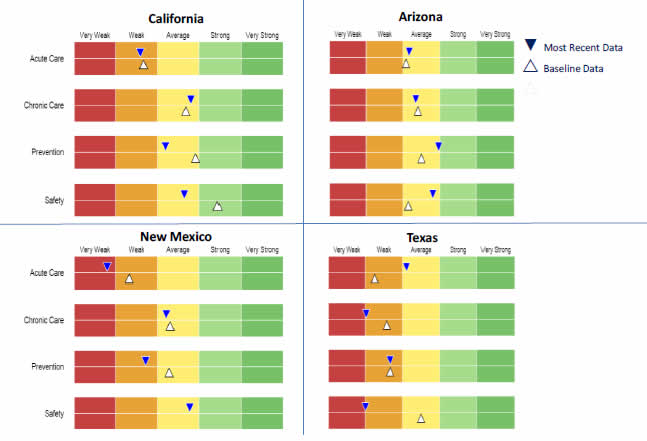
Source: AHRQ State Snapshots 2014. http://nhqrnet.ahrq.gov/inhqrdr/state/select.
- Geographic Variation:
- Border States vary in the quality of different types of care delivered. An overall quality score is computed for each State based on the number of quality measures that are above, at, or below the average across all States; the median score is typically around 50 and is shown as the middle of the yellow band above.
- California and New Mexico are weak in acute care. New Mexico and Texas are weak in prevention. Texas is also weak in chronic care and safety.
Hospital Care on the U.S.-Mexico Border
- While many of the data sources used in the QDR can provide State estimates, most cannot provide estimates at the substate level.
- In this section, we present findings from hospital data from U.S. states that can drill down to the county level. In future, we hope to identify and include data sources that can provide county estimates for care delivered in other settings.
- We also include links to some successful quality improvement interventions from the AHRQ Health Care Innovations Exchange (https://innovations.ahrq.gov) that involved sites on the border.
Purpose
- Compare hospital services in counties along the U.S.-Mexico border to non-border U.S. counties in the four border States:
- AZ, CA, NM, TX.
- Focus on priority conditions identified by the U.S.-Mexico Border Commission.
- Report results by ethnicity.
Data Source
- Discharge counts:
- Healthcare Cost and Utilization Project.
2013 State Inpatient Databases for four States: Arizona, California, New Mexico, and Texas.
- Border counties within 60 miles of Mexico.
- Discharges grouped by the county of the hospital.
- Limited to community hospitals, excluding rehabilitation hospitals.
- Included all patients treated in those hospitals, including foreign and out-of-state patients.
- Healthcare Cost and Utilization Project.
- Population denominators:
- Residents of border and non-border counties.
- Nielsen demographic data.
Population Characteristics
Distribution by Race/Ethnicity
Percentage of the Population, by Race/Ethnicity
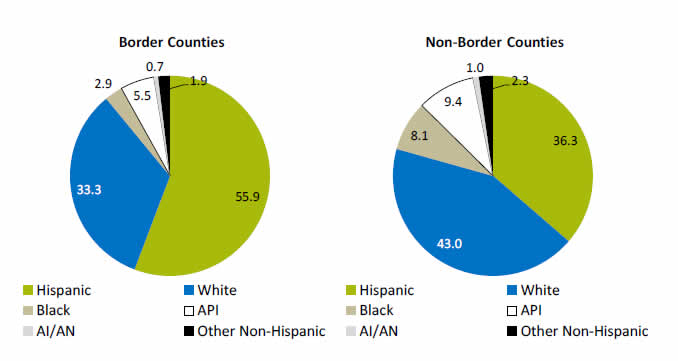
Key: AI/AN=American Indian/Alaska Native; API=Asian/Pacific Islander.
Source: 2013 Nielsen-Claritas ZIP Code estimates aggregated to counties.
- In border counties, 56% of the population was Hispanic, compared with only 36% in non-border counties.
Distribution by Age
Percentage of the Population, by Age Group
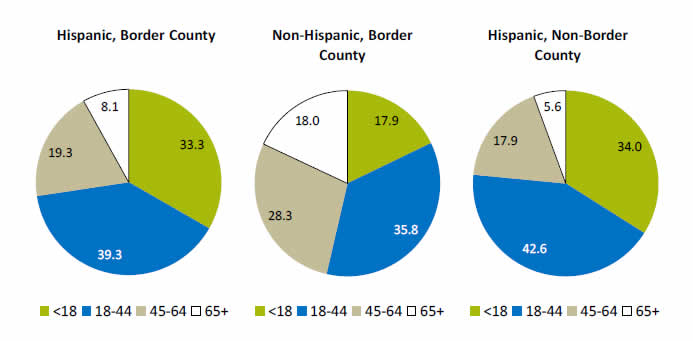
Source: 2013 Nielsen-Claritas ZIP Code estimates aggregated to counties.
- The age distribution of Hispanics in border and non-border counties was similar. However, non-Hispanics in border counties were older—nearly half were age 45 and over.
Characteristics of Inpatient Hospital Stays
Hospital Characteristics
Hospital Characteristics, by County
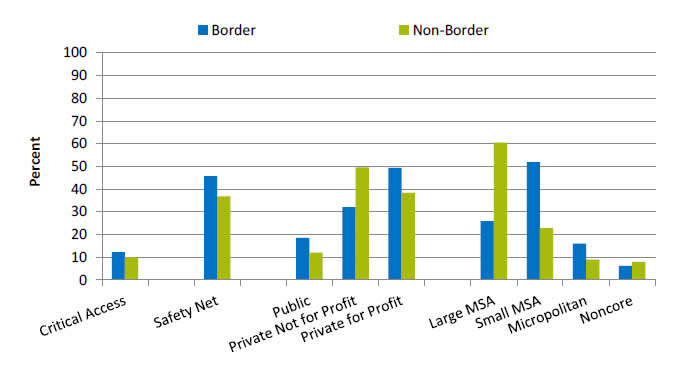
Key: MSA = metropolitan statistical area.
Source: Agency for Healthcare Research and Quality, Healthcare Cost and Utilization Project, State Inpatient Databases for four States: Arizona, California, New Mexico, and Texas; 2013.
- This analysis included 81 hospitals located in border counties and 789 hospitals located in the non-border counties of Arizona, California, New Mexico, and Texas.
- Compared with non-border hospitals, border hospitals were more likely to be:
- Safety net facilities.
- Public or private for profit.
- Located in small metropolitan or micropolitan areas.
Number of Inpatient Stays by County of Residence
| Patient's County of Residence | Hospital County | |||
|---|---|---|---|---|
| Border County (N=800,797; 11%) |
Non-Border County (N=6,499,597; 89%) |
|||
| N | % | N | % | |
| Border county in 4 study States | 753,944 | 94.1 | 37,299 | 0.6 |
| Non-border county in 4 study States | 24,818 | 3.1 | 6,352,997 | 97.7 |
| Mexico | 6,303 | 0.8 | 939 | 0.0 |
| Other U.S. States | 8,223 | 1.0 | 82,030 | 1.3 |
| Missing | 7,509 | 0.9 | 26,332 | 0.4 |
Source: Agency for Healthcare Research and Quality, Healthcare Cost and Utilization Project, State Inpatient Databases for four States: Arizona, California, New Mexico, and Texas; 2013.
Note: Presented analysis is based on the hospital county.
Distribution by Age
Percentage of Inpatient Stays, by Age Group
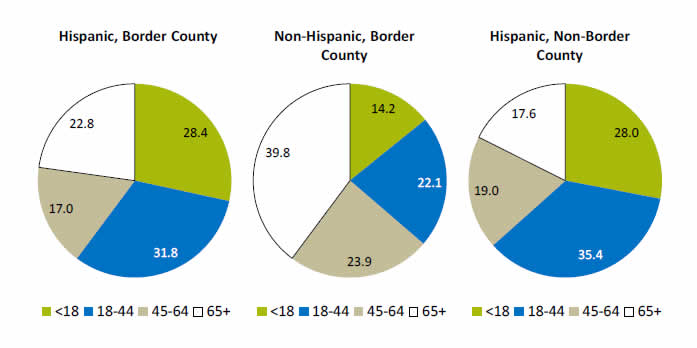
Source: Agency for Healthcare Research and Quality, Healthcare Cost and Utilization Project, State Inpatient Databases for four States: Arizona, California, New Mexico, and Texas; 2013.
- The age distribution of Hispanic inpatient stays in border and non-border counties was similar. However, non-Hispanics with an inpatient stay in border counties were older—64% were age 45 and over.
Distribution by Service Line
Percentage of Inpatient Stays, by Service Line
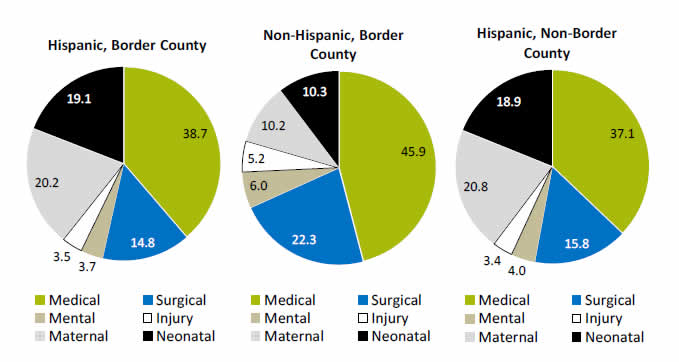
Source: Agency for Healthcare Research and Quality, Healthcare Cost and Utilization Project, State Inpatient Databases for four States: Arizona, California, New Mexico, and Texas; 2013.
- In both border and non-border counties, 40% of Hispanic inpatient stays were maternal/neonatal.
- In comparison, only 20% of non-Hispanic stays in border counties were maternal/neonatal.


