- Thirty years ago, the Heckler Report found that:
- There is considerable variation within the Hispanic population, and while postneonatal mortality rates are elevated, the birth weight distributions are generally favorable.
- Only 58% of Mexican American mothers begin prenatal care in the first trimester, less than for Blacks or Whites.
- The birth weight and hence infant mortality rates of U.S.-born Puerto Ricans are less favorable than those for Mexican Americans.
- Data on birth weight show a favorable distribution for Cubans.
Maternity Care for Hispanics
| Measure | Most Recent Disparity | Disparity Change |
|---|---|---|
| Live-born infants with low birth weight (less than 2,500 grams) | Same | No Change |
| Live-born infants with very low birth weight (less than 1,500 grams) | Same | Growing |
| Infant mortality per 1,000 live births | Same | No Change |
| Maternal deaths per 100,000 live births | Same | Narrowing |
| Birth trauma—injury to newborn per 1,000 live births | Better | No Change |
| Obstetric trauma per 1,000 vaginal deliveries without instrument assistance | Better | No Change |
| Obstetric trauma per 1,000 instrument-assisted vaginal deliveries | Better | No Change |
- Trends: Birth trauma and obstetric trauma were improving over time but other measures of maternity care were not changing.
- Groups With Disparities:
- Hispanics had lower rates of birth trauma and obstetric trauma than Whites and these disparities were not changing over time.
Infants With Low Birth Weight
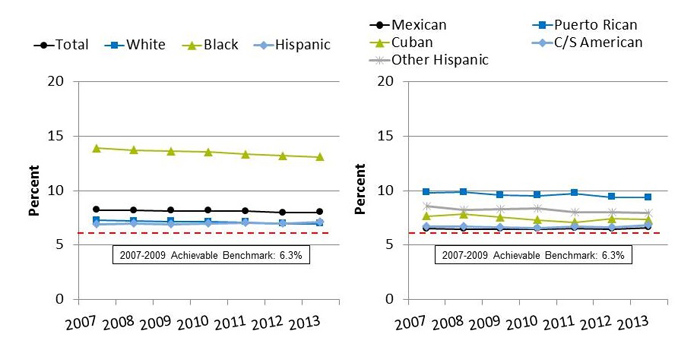
Live-born infants with low birth weight (less than 2,500 grams), by race/ethnicity and Hispanic group, 2007-2013

Left Graph:
| Race/Ethnicity | 2007 | 2008 | 2009 | 2010 | 2011 | 2012 | 2013 |
|---|---|---|---|---|---|---|---|
| Total | 8.22 | 8.18 | 8.16 | 8.15 | 8.10 | 7.99 | 8.02 |
| White | 7.28 | 7.22 | 7.19 | 7.14 | 7.09 | 6.97 | 6.98 |
| Black | 13.90 | 13.71 | 13.61 | 13.53 | 13.33 | 13.18 | 13.08 |
| Hispanic | 6.93 | 6.96 | 6.94 | 6.97 | 7.02 | 6.97 | 7.09 |
2007-2009 Achievable Benchmark: 6.3%.
Right Graph:
| Hispanic Group | 2007 | 2008 | 2009 | 2010 | 2011 | 2012 | 2013 |
|---|---|---|---|---|---|---|---|
| Mexican | 6.50 | 6.49 | 6.47 | 6.49 | 6.55 | 6.48 | 6.62 |
| Puerto Rican | 9.83 | 9.86 | 9.59 | 9.55 | 9.75 | 9.40 | 9.38 |
| Cuban | 7.66 | 7.83 | 7.55 | 7.30 | 7.10 | 7.43 | 7.35 |
| C/S American | 6.71 | 6.70 | 6.64 | 6.55 | 6.70 | 6.64 | 6.85 |
| Other Hispanic | 8.61 | 8.24 | 8.28 | 8.38 | 8.02 | 8.00 | 7.99 |
2007-2009 Achievable Benchmark: 6.3%.
Key: C/S American = Central or South American.
Source: Centers for Disease Control and Prevention, National Center for Health Statistics, National Vital Statistics System—Natality, 2007-2013.
Denominator: Live births with known birth weight.
- Importance: Low birth weight can put infants at risk of various complications and death. Adequate prenatal care can help ensure that babies are born full term and at a healthy weight.
- Trends: From 2007 to 2013, the percentage of live-born infants with low birth weight improved among Blacks but did not change overall or for Whites or Hispanics.
- Groups With Disparities:
- In all years, Black infants were more likely than White infants to be low birth weight.
- In all years, Puerto Rican infants were more likely than White infants to be low birth weight.
- Achievable Benchmark:
- The 2007-2009 top 5 State achievable benchmark was 6.3%. The top 5 States that contributed to the achievable benchmark are Alaska, Maine, Oregon, South Dakota, and Washington.
- Except Black infants, no groups showed movement toward the benchmark.
Infants With Very Low Birth Weight
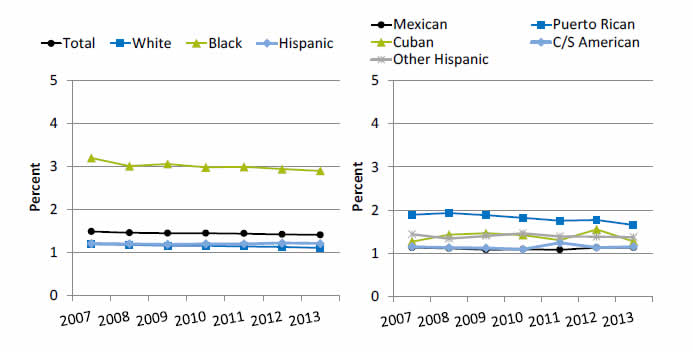
Live-born infants with very low birth weight (less than 1,500 grams), by race/ethnicity and Hispanic group, 2007-2013

Left Graph:
| Race/Ethnicity | 2007 | 2008 | 2009 | 2010 | 2011 | 2012 | 2013 |
|---|---|---|---|---|---|---|---|
| Total | 1.49 | 1.46 | 1.45 | 1.45 | 1.44 | 1.42 | 1.41 |
| White | 1.19 | 1.18 | 1.16 | 1.16 | 1.14 | 1.13 | 1.11 |
| Black | 3.20 | 3.01 | 3.06 | 2.98 | 2.99 | 2.94 | 2.90 |
| Hispanic | 1.21 | 1.20 | 1.19 | 1.20 | 1.20 | 1.22 | 1.21 |
Right Graph:
| Hispanic Group | 2007 | 2008 | 2009 | 2010 | 2011 | 2012 | 2013 |
|---|---|---|---|---|---|---|---|
| Mexican | 1.13 | 1.11 | 1.08 | 1.09 | 1.08 | 1.13 | 1.13 |
| Puerto Rican | 1.89 | 1.93 | 1.88 | 1.82 | 1.75 | 1.77 | 1.65 |
| Cuban | 1.27 | 1.43 | 1.46 | 1.42 | 1.30 | 1.55 | 1.27 |
| C/S American | 1.15 | 1.13 | 1.12 | 1.09 | 1.24 | 1.13 | 1.15 |
| Other Hispanic | 1.44 | 1.34 | 1.40 | 1.46 | 1.39 | 1.38 | 1.37 |
Key: C/S American = Central or South American.
Source: Centers for Disease Control and Prevention, National Center for Health Statistics, National Vital Statistics System—Natality.
Denominator: Live births with known birth weight.
- Trends: From 2007 to 2013, the percentage of live-born infants with very low birth weight improved overall and among Whites and Blacks but did not change among Hispanics. This led to a widening of the Hispanic-White difference although it is still below our threshold for identifying statistically significant disparities.
- Groups With Disparities:
- In all years, Black infants were more likely than White infants to have very low birth weight.
- In all years, Puerto Rican infants were more likely than White infants to have very low birth weight.
Infant Mortality
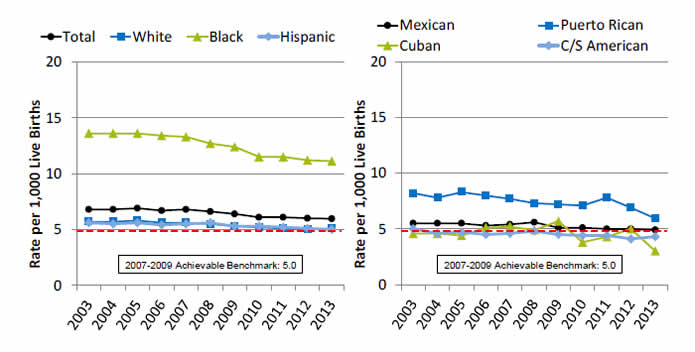
Infant mortality per 1,000 live births, by race/ethnicity and Hispanic group, 2003-2013

Left Graph:
| Race/Ethnicity | 2003 | 2004 | 2005 | 2006 | 2007 | 2008 | 2009 | 2010 | 2011 | 2012 | 2013 |
|---|---|---|---|---|---|---|---|---|---|---|---|
| Total | 6.8 | 6.8 | 6.9 | 6.7 | 6.8 | 6.6 | 6.4 | 6.1 | 6.1 | 6.0 | 6.0 |
| White | 5.7 | 5.7 | 5.8 | 5.6 | 5.6 | 5.5 | 5.3 | 5.2 | 5.1 | 5.0 | 5.1 |
| Black | 13.6 | 13.6 | 13.6 | 13.4 | 13.3 | 12.7 | 12.4 | 11.5 | 11.5 | 11.2 | 11.1 |
| Hispanic | 5.6 | 5.5 | 5.6 | 5.4 | 5.5 | 5.6 | 5.3 | 5.3 | 5.2 | 5.1 | 5.0 |
2007-2009 Achievable Benchmark: 5.0.
Right Graph:
| Hispanic Group | 2003 | 2004 | 2005 | 2006 | 2007 | 2008 | 2009 | 2010 | 2011 | 2012 | 2013 |
|---|---|---|---|---|---|---|---|---|---|---|---|
| Mexican | 5.5 | 5.5 | 5.5 | 5.3 | 5.4 | 5.6 | 5.1 | 5.1 | 5.0 | 5.0 | 4.9 |
| Puerto Rican | 8.2 | 7.8 | 8.3 | 8.0 | 7.7 | 7.3 | 7.2 | 7.1 | 7.8 | 6.9 | 5.9 |
| Cuban | 4.6 | 4.6 | 4.4 | 5.1 | 5.2 | 4.9 | 5.7 | 3.8 | 4.3 | 5.0 | 3.0 |
| C/S American | 5.0 | 4.6 | 4.7 | 4.5 | 4.6 | 4.8 | 4.5 | 4.4 | 4.4 | 4.1 | 4.3 |
2007-2009 Achievable Benchmark: 5.0.
Key: C/S American = Central or South American.
Source: Centers for Disease Control and Prevention, National Center for Health Statistics, National Vital Statistics System—Linked Birth/Infant Death Data Set.
Denominator: Live births with known birth weight.
- Trends: From 2003 to 2013, the rate of infant mortality among live births improved overall and among Whites and Blacks but changes among Hispanics were not statistically significant.
- Groups With Disparities:
- In all years, mortality was higher among Black infants than White infants.
- In all years, mortality was higher among Puerto Rican infants than White infants.
- Achievable Benchmark:
- The 2007-2009 top 5 State achievable benchmark was 5 per 1,000 live births. The top 5 States that contributed to the achievable benchmark are California, Massachusetts, New Hampshire, Utah, and Washington.
- Hispanics, including Mexicans, Cubans, and Central and South Americans, have achieved the benchmark. Whites and Puerto Ricans are close to the benchmark. Blacks are farthest from the benchmark.
Birth Trauma
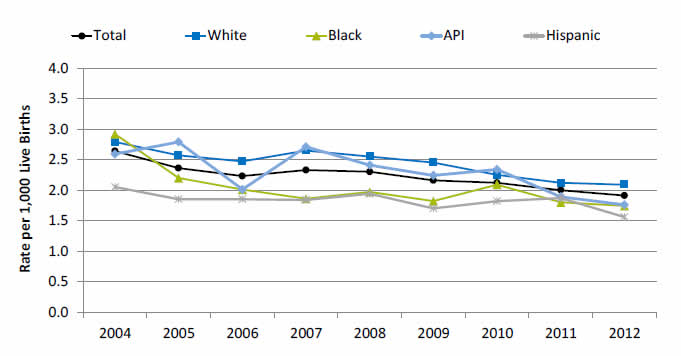
Birth trauma—injury to neonate per 1,000 live births, by race/ethnicity, 2004-2012

| Year | Total | White | Black | API | Hispanic |
|---|---|---|---|---|---|
| 2004 | 2.6 | 2.8 | 2.9 | 2.6 | 2.1 |
| 2005 | 2.4 | 2.6 | 2.2 | 2.8 | 1.9 |
| 2006 | 2.2 | 2.5 | 2.0 | 2.0 | 1.9 |
| 2007 | 2.3 | 2.7 | 1.9 | 2.7 | 1.8 |
| 2008 | 2.3 | 2.6 | 2.0 | 2.4 | 1.9 |
| 2009 | 2.2 | 2.5 | 1.8 | 2.2 | 1.7 |
| 2010 | 2.1 | 2.3 | 2.1 | 2.3 | 1.8 |
| 2011 | 2.0 | 2.1 | 1.8 | 1.9 | 1.9 |
| 2012 | 1.9 | 2.1 | 1.7 | 1.8 | 1.6 |
Key: API = Asian or Pacific Islander.
Source: Agency for Healthcare Research and Quality (AHRQ), Healthcare Cost and Utilization Project, State Inpatient Databases, 2004‐2012 disparities analysis files and AHRQ Quality Indicators, modified version 4.4.
- Trends:
- Birth trauma-neonatal injury rates fell from 2.6 per 1,000 live births in 2004 to 1.9 per 1,000 live births in 2012.
- Between 2004 and 2012, birth trauma-neonatal injury rates fell for all racial/ethnic groups.
- Groups With Disparities:
- In 2012, White neonates experienced an injury rate of 2.1 per 1,000 live births compared with 1.6 per 1,000 live births for Hispanic neonates.
- There were no other statistically significant differences between groups.


