Priority Areas Identified by the U.S.-Mexico Border Commission
Priority areas identified by Healthy Border 2010/2020. Those in bold are areas for which we provide data.
- Access to Health Care—ensuring access to primary care or basic health care services.
- Cancer—reducing breast cancer and cervical cancer mortality.
- Diabetes—reducing both the mortality rate of diabetes and the need for hospitalization.
- Environmental Health—improving household access to sewage disposal and reducing hospital admissions for acute pesticide poisoning.
- HIV/AIDS—reducing the incidence of HIV/AIDS.
- Immunization and Infectious Diseases—expanding immunization coverage for young children, as well as reducing the incidence of hepatitis and tuberculosis.
- Injury Prevention—reducing mortality from motor vehicle crashes as well as childhood mortality from injuries.
- Maternal, Infant, and Child Health—reducing infant mortality due to congenital defects, improving prenatal care, and reducing teenage pregnancy rates.
- Mental Health—reducing suicide mortality.
- Oral Health—improving access to oral health care.
- Respiratory Diseases—reducing the rate of hospitalization for asthma.
Select for:
- Access to Health Care
- Complications of Inpatient Hospital Stays With Diabetes
- Complications Among Inpatient Hospital Stays for Mental Health or Substance Abuse
- Border County Residents Treated at Non-Border Hospitals
Access to Health Care
Distribution of Inpatient Stays by Payer
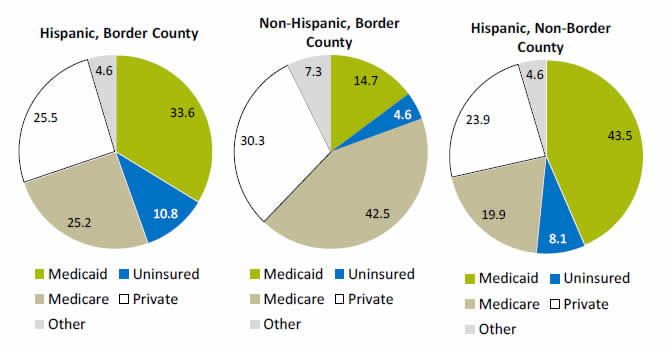
Access to Health Care: Percentage of Inpatient Stays, by Expected Payer
Source: Agency for Healthcare Research and Quality, Healthcare Cost and Utilization Project, State Inpatient Databases for four States: Arizona, California, New Mexico, and Texas; 2013.
- Access to health care varies by ethnicity and geographic location.
- Almost 11% of Hispanic inpatient stays in border counties were not covered by insurance, compared with:
- 4.6% of non-Hispanic stays in border counties.
- 8.1% of Hispanic stays in non-border counties.
- One-third of Hispanic inpatient stays in border counties were paid by Medicaid, compared with:
- Only 15% of non-Hispanic stays in border counties.
- About 44% of Hispanic stays in non-border counties.
AHRQ Health Care Innovations on the Border
- Location: Yuma County, Arizona.
- Population: Mexican farm workers.
- Intervention: Partnership between a health clinic system and a community organization, to coordinate outreach workers, known as promotoras, who help participants navigate the health care system and improve their health.
- Outcomes: Participants increased physical activity, improved dietary habits, and had higher satisfaction with their health care.
Age-Sex Adjusted Rate of Hospital Stays, by Ethnicity
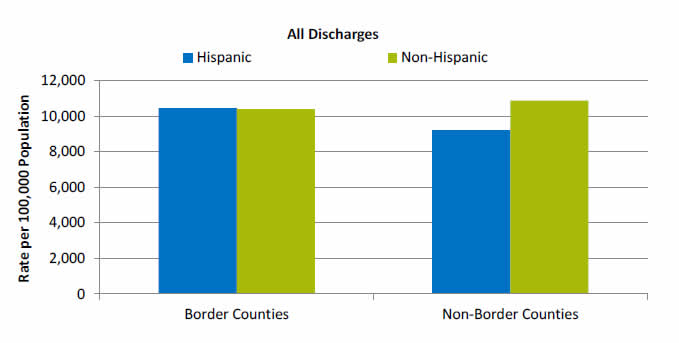
Age-Sex Adjusted Rate of Inpatient Hospital Stays in Border and Non-Border Counties, by Hispanic Ethnicity
Source: Agency for Healthcare Research and Quality, Healthcare Cost and Utilization Project, State Inpatient Databases for four States: Arizona, California, New Mexico, and Texas; 2013.
Note: Hispanic, Border vs. Non-Border, RR=1.14 (p<0.05 and 10% difference); Non-Hispanic, Border vs. Non-Border, RR=0.96; Border, Hispanic vs. Non-Hispanic, RR=1.01; Non-Border, Hispanic vs. Non-Hispanic, RR=0.85 (p<0.05 and 10% difference).
- Among Hispanics, the rate of stays was 1.14 times as high in border counties compared with non-border counties.
- In non-border counties, Hispanics had lower rates of stays than non-Hispanics.
Population-Based Rates of Inpatient Hospital Stays by Service Line
Rates of Inpatient Hospital Stays in Border vs. Non-Border Counties and Among Hispanics vs. Non- Hispanics, by Service Line
| Service Line | Ratio of Age-Sex Adjusted Rate of Hospitalization | |||
|---|---|---|---|---|
| Hispanics vs. Non-Hispanics | Border vs. Non-Border Counties | |||
| Border Counties | Non-Border Counties | Hispanics | Non-Hispanics | |
| Maternal | 1.35(a) | 0.98 | 1.25(a) | 0.90 |
| Neonatal | 0.83(b) | 0.62(b) | 1.36(a) | 1.00 |
| Mental health/substance abuse | 0.73(b) | 0.79(b) | 1.05 | 1.14(a) |
| Injury | 0.63(b) | 0.62(b) | 1.19(a) | 1.18(a) |
| Surgical | 0.85(b) | 0.81(b) | 1.04 | 0.98 |
| Medical | 1.14(a) | 0.93 | 1.10 | 0.90 |
Source: Agency for Healthcare Research and Quality, Healthcare Cost and Utilization Project, State Inpatient Databases for four States: Arizona, California, New Mexico, and Texas; 2013.
Note: Shaded cells (a = pink, b = green) represent statistically significant differences (p<.05) of 10% or greater.
- Hispanics generally had lower rates of hospitalization than non-Hispanics, except in the medical and maternal service lines, in both border and non-border counties.
- Compared with Hispanics in non-border counties, Hispanics in border counties had higher rates of hospitalization in the injury, maternal, and neonatal service lines.
- Service lines are shown in the order they are assigned–every discharge is assigned to a hospital service line hierarchically, based on the following order: maternal and neonatal, mental health, injury, surgical, and medical. Classification for maternal and neonatal, mental health, and injury are based on the International Classification of Diseases (ICD-9-CM) principal diagnosis codes or Clinical Classifications Software (CCS). Surgical and medical splits are based on the diagnosis-related groups (DRGs). The discharge is assigned to medical if the DRG indicates ungroupable.
Age-Sex Adjusted Rate of Maternal Inpatient Stays, by Ethnicity
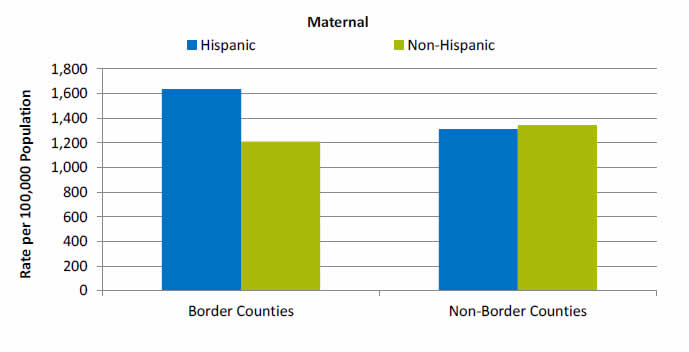
Age-Sex Adjusted Rate of Maternal Inpatient Hospital Stays in Border and Non-Border Counties, by Hispanic Ethnicity
Source: Agency for Healthcare Research and Quality, Healthcare Cost and Utilization Project, State Inpatient Databases for four States: Arizona, California, New Mexico, and Texas; 2013.
Note: Hispanic, Border vs. Non-Border, RR=1.25 (p<0.05 and 10% difference); Non-Hispanic, Border vs. Non-Border, RR=0.90; Border, Hispanic vs. Non-Hispanic, RR=1.35 (p<0.05 and 10% difference); Non-Border, Hispanic vs. Non-Hispanic, RR=0.98.
- Hispanics in border counties had higher rates of maternal stays compared with both:
- Hispanics in non-border counties.
- Non-Hispanics in border counties.
Age-Sex Adjusted Rate of Neonatal Inpatient Stays, by Ethnicity
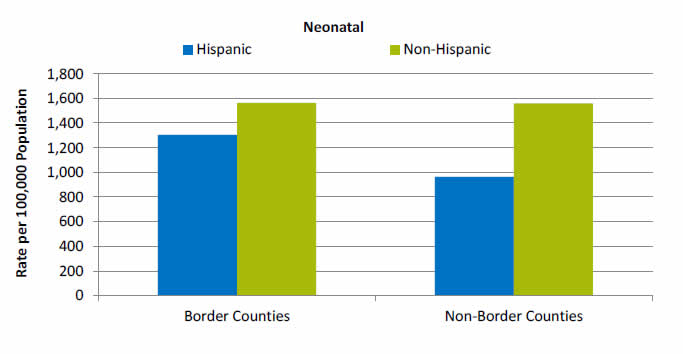
Age-Sex Adjusted Rate of Neonatal Inpatient Hospital Stays in Border and Non-Border Counties, by Hispanic Ethnicity
Source: Agency for Healthcare Research and Quality, Healthcare Cost and Utilization Project, State Inpatient Databases for four States: Arizona, California, New Mexico, and Texas; 2013.
Note: Hispanic, Border vs. Non-Border, RR=1.36 (p<0.05 and 10% difference); Non-Hispanic, Border vs. Non-Border, RR=1.00; Border, Hispanic vs. Non-Hispanic, RR=0.83 (p<0.05 and 10% difference); Non-Border, Hispanic vs. Non-Hispanic, RR=0.62 (p<0.05 and 10% difference).
- Among Hispanics, the rate of neonatal stays was higher in border counties than in non-border counties.
- Hispanics had lower rates of neonatal stays than non-Hispanics, both in border and non-border counties.
Age-Sex Adjusted Rate of Mental Health and Substance-Related Inpatient Stays, by Ethnicity
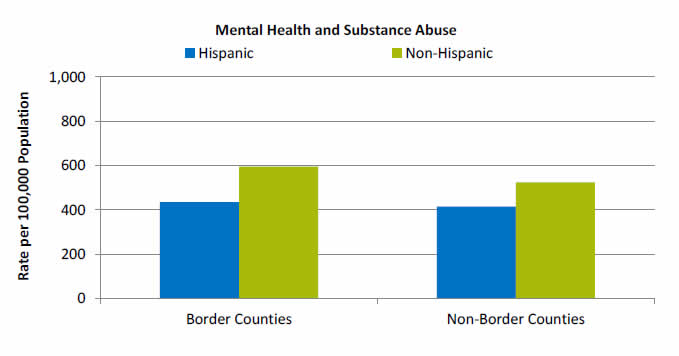
Age-Sex Adjusted Rate of Mental Health and Substance-Related Inpatient Hospital Stays in Border and Non-Border Counties, by Hispanic Ethnicity
Source: Agency for Healthcare Research and Quality, Healthcare Cost and Utilization Project, State Inpatient Databases for four States: Arizona, California, New Mexico, and Texas; 2013.
Note: Hispanic, Border vs. Non-Border, RR=1.05; Non-Hispanic, Border vs. Non-Border, RR=1.14 (p<0.05 and 10% difference); Border, Hispanic vs. Non-Hispanic, RR=0.73 (p<0.05 and 10% difference); Non-Border, Hispanic vs. Non-Hispanic, RR=0.79 (p<0.05 and 10% difference).
- Hispanics had lower rates of mental health and substance-related stays than non-Hispanics, both in border and non-border counties.
- Among non-Hispanics, those in border counties had higher rates of mental health and substance-related stays than non-Hispanics in non-border counties.
Age-Sex Adjusted Rate of Injury Inpatient Stays, by Ethnicity
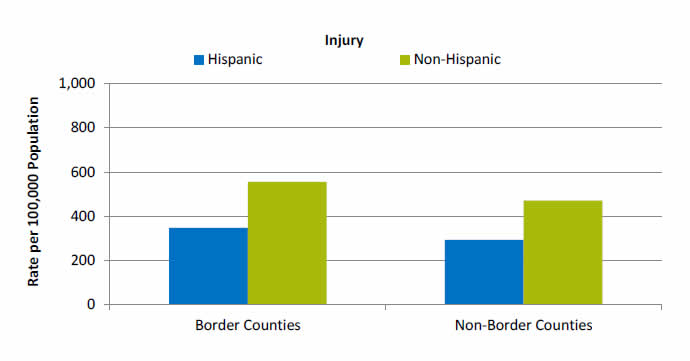
Age-Sex Adjusted Rate of Injury Inpatient Hospital Stays in Border and Non-Border Counties, by Hispanic Ethnicity
Source: Agency for Healthcare Research and Quality, Healthcare Cost and Utilization Project, State Inpatient Databases for four States: Arizona, California, New Mexico, and Texas; 2013.
Note: Hispanic, Border vs. Non-Border, RR=1.19 (p<0.05 and 10% difference); Non-Hispanic, Border vs. Non-Border, RR=1.18 (p<0.05 and 10% difference); Border, Hispanic vs. Non-Hispanic, RR=0.63 (p<0.05 and 10% difference); Non-Border, Hispanic vs. Non-Hispanic, RR=0.62 (p<0.05 and 10% difference).
- Rates of injury stays were higher in border than non-border counties, both for Hispanics and non- Hispanics.
- Rates of injury stays were lower among Hispanics than non-Hispanics, both in border and non-border counties.
Age-Sex Adjusted Rate of Surgical Inpatient Stays, by Ethnicity
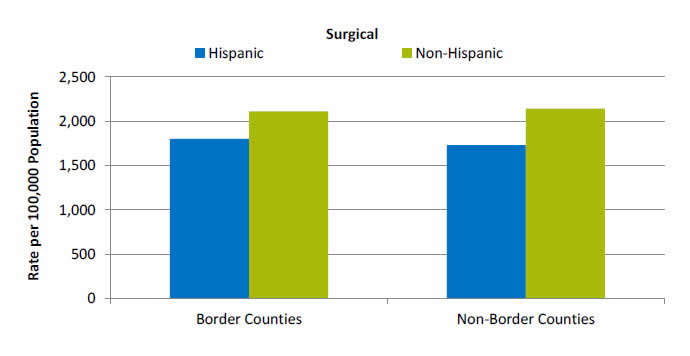
Age-Sex Adjusted Rate of Surgical Inpatient Hospital Stays in Border and Non-Border Counties, by Hispanic Ethnicity
Source: Agency for Healthcare Research and Quality, Healthcare Cost and Utilization Project, State Inpatient Databases for four States: Arizona, California, New Mexico, and Texas; 2013.
Note: Hispanic, Border vs. Non-Border, RR=1.04; Non-Hispanic, Border vs. Non-Border, RR=0.98; Border, Hispanic vs. Non-Hispanic, RR=0.85 (p<0.05 and 10% difference); Non-Border, Hispanic vs. Non-Hispanic, RR=0.81 (p<0.05 and 10% difference).
- Hispanics had lower rates of surgical stays, both in border and non-border counties.
Age-Sex Adjusted Rate of Medical Inpatient Stays, by Ethnicity
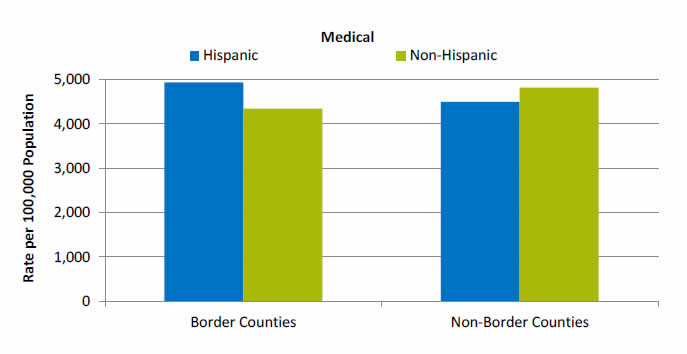
Age-Sex Adjusted Rate of Medical Inpatient Hospital Stays in Border and Non-Border Counties, by Hispanic Ethnicity
Source: Agency for Healthcare Research and Quality, Healthcare Cost and Utilization Project, State Inpatient Databases for four States: Arizona, California, New Mexico, and Texas; 2013.
Note: Hispanic, Border vs. Non-Border, RR=1.10; Non-Hispanic, Border vs. Non-Border, RR=0.90; Border, Hispanic vs. Non-Hispanic, RR=1.14 (p<0.05 and 10% difference); Non-Border, Hispanic vs. Non-Hispanic, RR=0.93.
- In border counties, Hispanics had higher rates of medical stays than non-Hispanics.
Population-Based Rates of Inpatient Hospital Stays for Select Conditions
Rates of Inpatient Hospital Stays in Border vs. Non-Border Counties and Among Hispanics vs. Non-Hispanics, by Condition
| Condition Identified as Priority Area by U.S.-Mexico Border Commission | Ratio of Age-Sex Adjusted Rate of Hospitalization | |||
|---|---|---|---|---|
| Hispanics vs. Non-Hispanics | Border vs. Non-Border Counties | |||
| Border Counties | Non-Border | Hispanics | Non-Hispanics | |
| Cancer* | 0.66(b) | 0.65(b) | 0.94 | 0.92 |
| Breast cancer | 0.58(b) | 0.59(b) | 0.96 | 0.97 |
| Cervical cancer | 0.90 | 0.90 | 0.93 | 0.93 |
| Chronic Kidney Disease | 1.63(a) | 1.16(a) | 1.12(a) | 0.80(b) |
| Diabetes | 1.72(a) | 1.32(a) | 1.11(a) | 0.85(b) |
| HIV/AIDS | 0.80 | 0.60(b) | 1.05 | 0.79(b) |
| Obesity, Adults | 1.23(a) | 0.91 | 1.17(a) | 0.86(b) |
| Obesity, Children | 1.17 | 1.45(a) | 0.98 | 1.21 |
| Oral Cancer | 0.58 | 0.65(b) | 0.81 | 0.90 |
| Respiratory† | 0.85(b) | 0.74(b) | 1.05 | 0.92 |
| Asthma | 0.61(b) | 0.72(b) | 0.79(b) | 0.94 |
| COPD | 0.77(b) | 0.59(b) | 1.18(a) | 0.91 |
Source: Agency for Healthcare Research and Quality, Healthcare Cost and Utilization Project, State Inpatient Databases for four States: Arizona, California, New Mexico, and Texas; 2013.
Note: Shaded cells (a = pink, b = green) represent statistically significant differences (p<.05) of 10% or greater. All rates are per 100,000 population.
*Cancer includes breast, cervical, prostate, and oral cancers.
†Respiratory includes asthma, chronic obstructive pulmonary disease, respiratory failure, and other respiratory diseases (e.g., pneumonia).
- Generally, Hispanics had lower rates of stays than non-Hispanics across the conditions examined, except for chronic kidney disease, diabetes, and obesity, in both border and non-border counties.
- Among Hispanics, those in border counties had higher rates of stays related to chronic kidney disease, diabetes, obesity, and COPD than those in non-border counties, but lower rates of asthma.
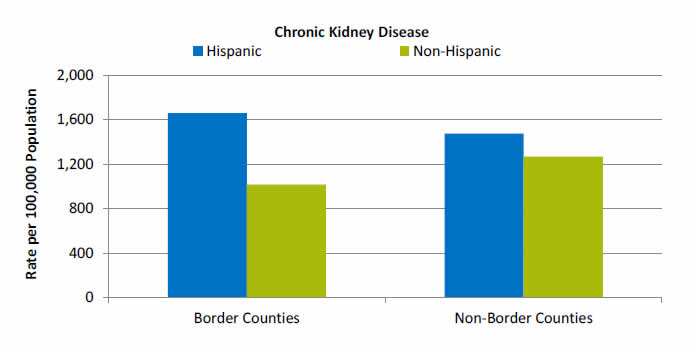
Age-Sex Adjusted Rate of Inpatient Stays With Chronic Kidney Disease, by Ethnicity
Age-Sex Adjusted Rate of Inpatient Hospital Stays With Chronic Kidney Disease in Border and Non-Border Counties, by Hispanic Ethnicity
Source: Agency for Healthcare Research and Quality, Healthcare Cost and Utilization Project, State Inpatient Databases for four States: Arizona, California, New Mexico, and Texas; 2013.
Note: Hispanic, Border vs. Non-Border, RR=1.12 (p<0.05 and 10% difference); Non-Hispanic, Border vs. Non-Border, RR=0.80 (p<0.05 and 10% difference); Border, Hispanic vs. Non-Hispanic, RR=1.63 (p<0.05 and 10% difference); Non-Border, Hispanic vs. Non-Hispanic, RR=1.16 (p<0.05 and 10% difference).
- For Hispanics in border counties, the rate of inpatient stays with chronic kidney disease was:
- 1.12 times as high as Hispanics in non-border counties.
- 1.63 times as high as non-Hispanics in border counties.
- Hispanics also had higher rates of chronic kidney disease in non-border counties, compared with non- Hispanics in non-border counties.
- Among non-Hispanics, those in border counties had lower rates of chronic kidney disease than those in non-border counties.
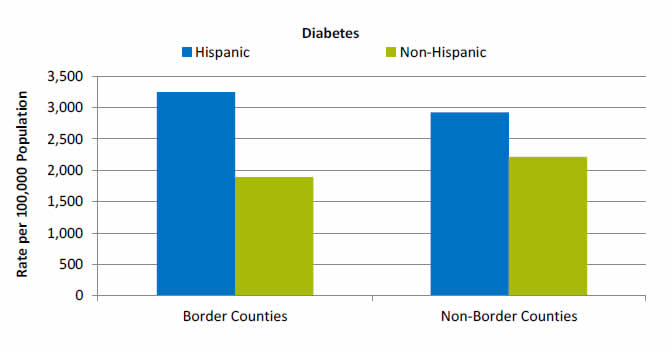
Age-Sex Adjusted Rate of Inpatient Stays With Diabetes, by Ethnicity
Age-Sex Adjusted Rate of Inpatient Hospital Stays With Diabetes in Border and Non-Border Counties, by Hispanic Ethnicity
Source: Agency for Healthcare Research and Quality, Healthcare Cost and Utilization Project, State Inpatient Databases for four States: Arizona, California, New Mexico, and Texas; 2013.
Note: Hispanic, Border vs. Non-Border, RR=1.11 (p<0.05 and 10% difference); Non-Hispanic, Border vs. Non-Border, RR=0.85 (p<0.05 and 10% difference); Border, Hispanic vs. Non-Hispanic, RR=1.72 (p<0.05 and 10% difference); Non-Border, Hispanic vs. Non-Hispanic, RR=1.32 (p<0.05 and 10% difference).
- For Hispanics in border counties, the rate of inpatient stays with diabetes was:
- 1.11 times as high as Hispanics in non-border counties.
- 1.72 times as high as non-Hispanics in border counties.
- Hispanics had higher rates of stays with diabetes than non-Hispanics, both in border and non-border counties.
- Among non-Hispanics, those in border counties had lower rates of stays with diabetes than those in non-border counties.
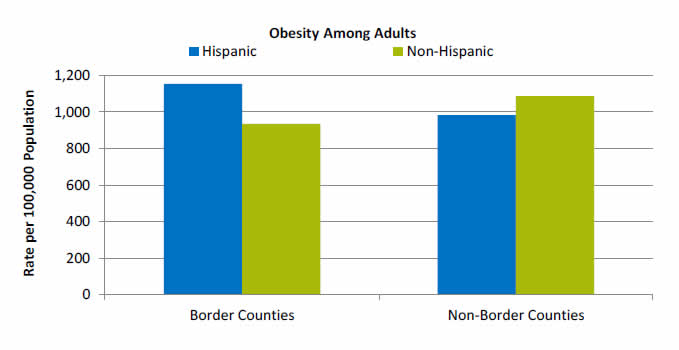
Age-Sex Adjusted Rate of Adult Inpatient Stays With Obesity, by Ethnicity
Age-Sex Adjusted Rate of Adult Inpatient Hospital Stays With Obesity in Border and Non-Border Counties, by Hispanic Ethnicity
Source: Agency for Healthcare Research and Quality, Healthcare Cost and Utilization Project, State Inpatient Databases for four States: Arizona, California, New Mexico, and Texas; 2013.
Note: Hispanic, Border vs. Non-Border, RR=1.17 (p<0.05 and 10% difference); Non-Hispanic, Border vs. Non-Border, RR=0.86 (p<0.05 and 10% difference); Border, Hispanic vs. Non-Hispanic, RR=1.23 (p<0.05 and 10% difference); Non-Border, Hispanic vs. Non-Hispanic, RR=0.91.
- For Hispanics in border counties, the rate of inpatient stays with adult obesity was:
- 1.17 times as high as Hispanics in non-border counties.
- 1.23 times as high as non-Hispanics in border counties.
- Among non-Hispanics, those in border counties had lower rates of adult obesity than those in non-border counties.
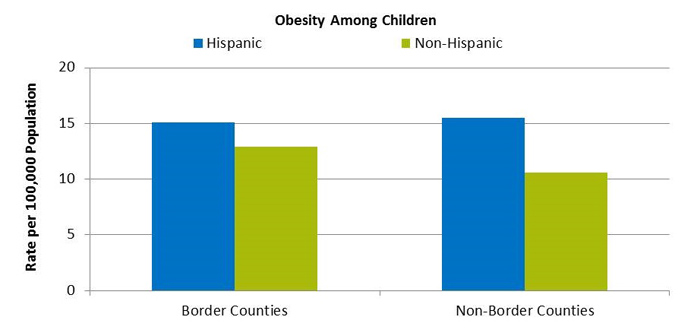
Age-Sex Adjusted Rate of Child Inpatient Stays With Obesity, by Ethnicity
Age-Sex Adjusted Rate of Child Inpatient Hospital Stays With Obesity in Border and Non-Border Counties, by Hispanic Ethnicity
Source: Agency for Healthcare Research and Quality, Healthcare Cost and Utilization Project, State Inpatient Databases for four States: Arizona, California, New Mexico, and Texas; 2013.
Note: Hispanic, Border vs. Non-Border, RR=0.98; Non-Hispanic, Border vs. Non-Border, RR=1.21; Border, Hispanic vs. Non-Hispanic, RR=1.17; Non-Border, Hispanic vs. Non-Hispanic, RR=1.45 (p<0.05 and 10% difference).
- In non-border counties, Hispanics had higher rates of child obesity than non-Hispanics.
AHRQ Health Care Innovations on the Border
- Location: Laredo, Texas, and Ciudad Victoria, Tamaulipas.
- Population: Mexican-American and other at-risk youth.
- Intervention: Comprehensive and culturally competent school-based behavior modification program intended to prevent or delay the onset of type 2 diabetes.
- Outcomes: Reduced risk factors, including body mass index, percentage of children with waist circumference at or above the 90th percentile, fasting insulin levels, and prevalence of obesity.
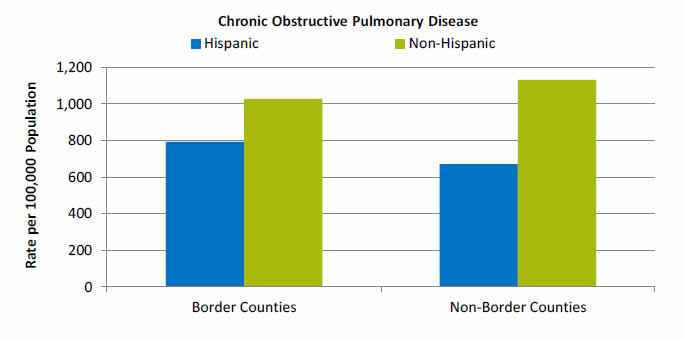
Age-Sex Adjusted Rate of Child Inpatient Stays With Chronic Obstructive Pulmonary Disease, by Ethnicity
Age-Sex Adjusted Rate of Inpatient Hospital Stays With COPD in Border and Non-Border Counties, by Hispanic Ethnicity
Source: Agency for Healthcare Research and Quality, Healthcare Cost and Utilization Project, State Inpatient Databases for four States: Arizona, California, New Mexico, and Texas; 2013.
Note: Hispanic, Border vs. Non-Border, RR=1.18 (p<0.05 and 10% difference); Non-Hispanic, Border vs. Non-Border, RR=0.91; Border, Hispanic vs. Non-Hispanic, RR=0.77 (p<0.05 and 10% difference); Non-Border, Hispanic vs. Non-Hispanic, RR=0.59 (p<0.05 and 10% difference).
- Among Hispanics, those in border counties had higher rates of COPD than those in non-border counties.
- Hispanics had lower rates of COPD than non-Hispanics, both in border and non-border counties.
AHRQ Health Care Innovations on the Border
El Rio Inner-City Asthma Intervention
- Location: Tucson, Arizona.
- Population: Low-income, inner-city Latino children with moderate or severe persistent asthma.
- Intervention: Comprehensive bilingual, bicultural program.
- Outcomes: Significantly reduced asthma-related emergency department visits, hospitalizations, missed school days, and sick days.


