Border County Residents Treated at Non-Border Hospitals
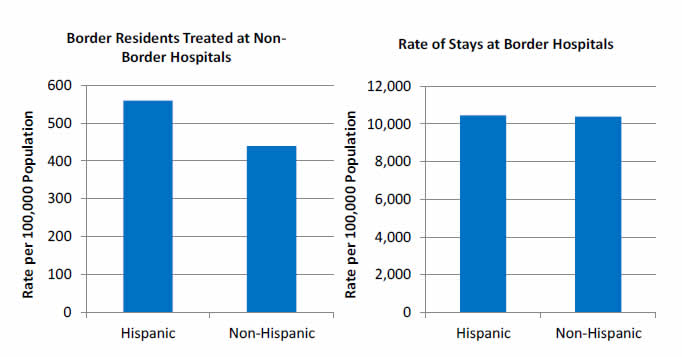
Age-Sex Adjusted Rate of Inpatient Stays in Border and Non-Border Hospitals
Age-Sex Adjusted Rate of Inpatient Hospital Stays in Border and Non-Border Counties, by Hispanic Ethnicity

Source: Agency for Healthcare Research and Quality, Healthcare Cost and Utilization Project, State Inpatient Databases for four States: Arizona, California, New Mexico, and Texas; 2013.
Note: Non-Border Hospitals: Hispanic vs. Non-Hispanic, RR=1.27 (p<0.05 and 10% difference); Border Hospitals: Hispanic vs. Non-Hispanic, RR=1.01.
- By excluding border residents treated at non-border hospitals from the analyses above, we lost about 600 stays per 100,000 population.
- The rate of stays at border hospitals was similar for Hispanics and non-Hispanics. However, the rate of stays for border residents treated at non-border hospitals was 1.3 times as high for Hispanics as for non-Hispanics.
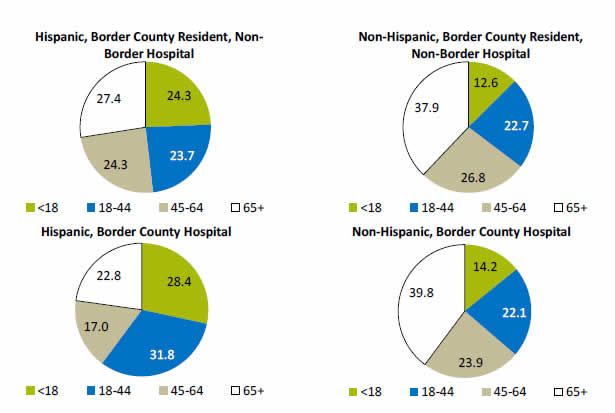
Distribution of Inpatient Stays by Age
Percentage of Inpatient Stays, by Age Group

Source: Agency for Healthcare Research and Quality, Healthcare Cost and Utilization Project, State Inpatient Databases for four States: Arizona, California, New Mexico, and Texas; 2013.
- The age distribution was generally similar for stays based on border county hospitals and border county residents treated at non-border hospitals.
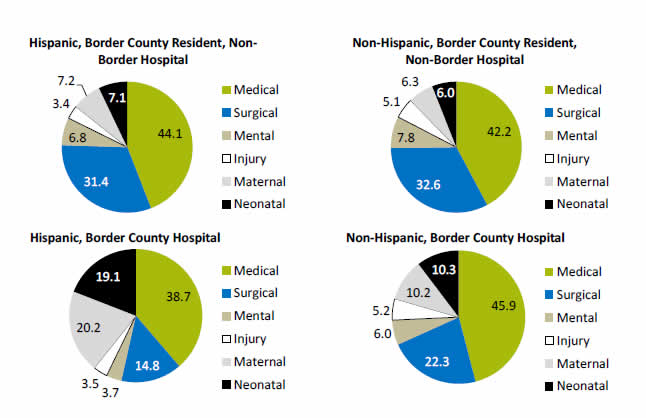
Distribution of Inpatient Stays by Service Line
Percentage of Inpatient Stays, by Service Line

Source: Agency for Healthcare Research and Quality, Healthcare Cost and Utilization Project, State Inpatient Databases for four States: Arizona, California, New Mexico, and Texas; 2013.
- Most discharges among border county residents treated at non-border hospitals were for surgical or medical reasons (75%) (versus, for instance, about 50% among Hispanics in border counties).
Leading Diagnoses for Inpatient Stays Among Border Residents Treated at Non-Border Hospitals
| Diagnosis | % |
|---|---|
| 218: Liveborn | 5.9 |
| 2: Septicemia (except in labor) | 3.3 |
| 237: Complication of device; implant or graft | 3.1 |
| 203: Osteoarthritis | 2.4 |
| 205: Spondylosis; intervertebral disc disorders; other back problems | 2.4 |
| 45: Maintenance chemotherapy; radiotherapy | 2.1 |
| 109: Acute cerebrovascular disease | 2.1 |
| 122: Pneumonia (except that caused by tuberculosis or sexually transmitted disease) | 2.0 |
| 100: Acute myocardial infarction | 1.9 |
| 108: Congestive heart failure; nonhypertensive | 1.8 |
Key: CCS=Clinical Classifications Software.
Source: Agency for Healthcare Research and Quality, Healthcare Cost and Utilization Project, State Inpatient Databases for four States: Arizona, California, New Mexico, and Texas; 2013.


