NQS Priority: Person-Centered Care
Communication With Health Providers: Adults
Adults who had a doctor’s office or clinic visit in the last 12 months who reported poor communication with health providers, by race/ethnicity and by income among Hispanics, 2002-2012
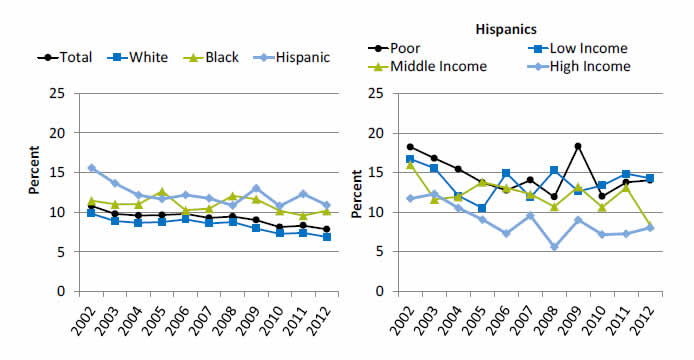
Left Graph:
| Race/Ethnicity | 2002 | 2003 | 2004 | 2005 | 2006 | 2007 | 2008 | 2009 | 2010 | 2011 | 2012 |
|---|---|---|---|---|---|---|---|---|---|---|---|
| Total | 10.8 | 9.8 | 9.6 | 9.7 | 9.8 | 9.3 | 9.5 | 9.0 | 8.1 | 8.3 | 7.9 |
| White | 9.8 | 8.9 | 8.7 | 8.8 | 9.1 | 8.6 | 8.8 | 8.0 | 7.3 | 7.4 | 6.9 |
| Black | 11.5 | 11.0 | 11.0 | 12.7 | 10.3 | 10.5 | 12.1 | 11.7 | 10.2 | 9.6 | 10.2 |
| Hispanic | 15.6 | 13.6 | 12.2 | 11.7 | 12.2 | 11.8 | 10.9 | 13.0 | 10.8 | 12.3 | 10.9 |
Right Graph (Hispanics):
| Income | 2002 | 2003 | 2004 | 2005 | 2006 | 2007 | 2008 | 2009 | 2010 | 2011 | 2012 |
|---|---|---|---|---|---|---|---|---|---|---|---|
| Poor | 18.3 | 16.8 | 15.4 | 13.7 | 12.8 | 14.1 | 11.9 | 18.3 | 12.0 | 13.8 | 14.0 |
| Low Income | 16.7 | 15.6 | 12.1 | 10.5 | 14.9 | 11.9 | 15.3 | 12.7 | 13.4 | 14.9 | 14.3 |
| Middle Income | 16.0 | 11.6 | 11.9 | 13.8 | 13.1 | 12.3 | 10.7 | 13.2 | 10.6 | 13.1 | 8.3 |
| High Income | 11.7 | 12.3 | 10.5 | 9.1 | 7.3 | 9.6 | 5.6 | 9.0 | 7.2 | 7.3 | 8.0 |
Source: Agency for Healthcare Research and Quality, Medical Expenditure Panel Survey, 2002-2012.
Denominator: Civilian noninstitutionalized population age 18 and over who had a doctor’s office or clinic visit in the last 12 months.
Note: For this measure, lower rates are better. Patients who report that their health providers sometimes or never listened carefully, explained things clearly, showed respect for what they had to say, or spent enough time with them are considered to have poor communication.
- Trends: From 2002 to 2012, the percentage of adults who reported poor communication with health providers significantly decreased for Whites, Hispanics, and all income groups. There were no statistically significant changes among Blacks.
- Groups With Disparities:
- In all years, Hispanics were significantly more likely than Whites to have poor communication with their health providers.
- In all years except 2006, Blacks were significantly more likely than Whites to have poor communication with their health providers.
- In all years except 2003, poor Hispanics were significantly more likely than high-income Hispanics to have poor communication with their health providers.
Communication With Health Providers: Children
Children who had a doctor’s office or clinic visit in the last 12 months whose parents reported poor communication with health providers, by race/ethnicity and language spoken at home, 2002-2012
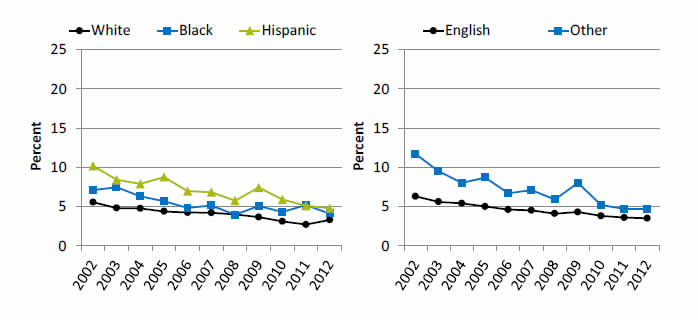
Left Graph:
| Race/Ethnicity | 2002 | 2003 | 2004 | 2005 | 2006 | 2007 | 2008 | 2009 | 2010 | 2011 | 2012 |
|---|---|---|---|---|---|---|---|---|---|---|---|
| White | 5.6 | 4.8 | 4.8 | 4.4 | 4.2 | 4.2 | 4.0 | 3.6 | 3.1 | 2.7 | 3.3 |
| Black | 7.1 | 7.5 | 6.3 | 5.7 | 4.8 | 5.1 | 4.0 | 5.1 | 4.3 | 5.2 | 4.1 |
| Hispanic | 10.2 | 8.4 | 7.9 | 8.8 | 7.0 | 6.8 | 5.8 | 7.4 | 5.9 | 5.1 | 4.8 |
Right Graph:
| Language | 2002 | 2003 | 2004 | 2005 | 2006 | 2007 | 2008 | 2009 | 2010 | 2011 | 2012 |
|---|---|---|---|---|---|---|---|---|---|---|---|
| English | 6.3 | 5.6 | 5.4 | 5.0 | 4.6 | 4.5 | 4.1 | 4.3 | 3.8 | 3.6 | 3.5 |
| Other | 11.7 | 9.5 | 8.0 | 8.7 | 6.7 | 7.1 | 5.9 | 8.0 | 5.2 | 4.7 | 4.7 |
Source: Agency for Healthcare Research and Quality, Medical Expenditure Panel Survey, 2002-2012.
Note: For this measure, lower rates are better. Parents who report that their child’s health providers sometimes or never listened carefully, explained things clearly, showed respect for what they had to say, or spent enough time with them are considered to have poor communication./p>
- Trends: From 2002 to 2012, the percentage of children whose parents reported poor communication with health providers significantly decreased for all ethnic groups and both language groups.
- Ethnicity:
- Whites: 5.6% to 3.3%.
- Blacks: 7.1% to 4.1%.
- Hispanics: 10.2% to 4.8%.
- Preferred language:
- English: 6.3% to 3.5%.
- Other: 11.7% to 4.7%.
- Ethnicity:
- Groups With Disparities:
- In 2012, parents of Hispanic children were significantly more likely to report poor communication compared with parents of White children.
- Also in 2012, there were no statistically significant differences between Blacks and Whites or by preferred language.
Provider-Patient Communication in Home Health Care
Provider-patient communication among adults receiving home health care, by language spoken at home, 2013
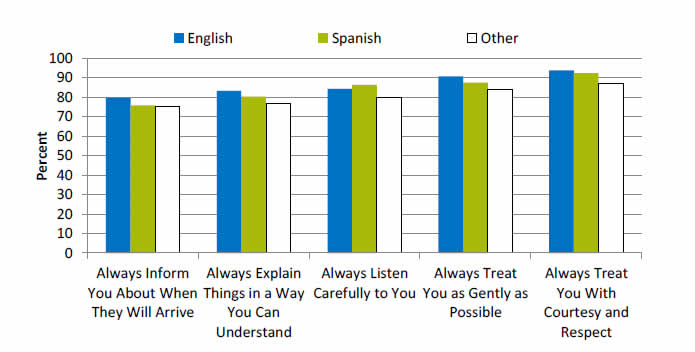
| Language | Always Inform You About When They Will Arrive | Always Explain Things in a Way You Can Understand | Always Listen Carefully to You | Always Treat You as Gently as Possible | Always Treat You With Courtesy and Respect |
|---|---|---|---|---|---|
| English | 79.6 | 83.1 | 84.3 | 90.7 | 93.8 |
| Other | 75.0 | 76.8 | 80.1 | 83.7 | 87.1 |
| Spanish | 75.7 | 80.4 | 86.2 | 87.5 | 92.3 |
Source: Centers for Medicare & Medicaid Services, Home Health Care CAHPS (Consumer Assessment of Healthcare Providers and Systems) Survey, 2013.
Denominator: Adults who had at least two visits from a Medicare-certified home health agency during a 2-month look-back period.
Note: Patients receiving hospice care and those who had "maternity" as the primary reason for receiving home health care are excluded.
- Groups With Disparities:
- In 2013, compared with English speakers, adults speaking Spanish or another language at home were significantly less likely to:
- Always be informed about when their provider would arrive.
- Always have things explained in a way that was easy to understand.
- Always be treated as gently as possible.
- Always be treated with courtesy and respect.
- Adults speaking a language other than English or Spanish were significantly less likely than English- and Spanish- speaking adults to always have the provider listen carefully to them.
- Adults speaking Spanish at home were significantly more likely than English-speaking adults to report that the provider always listened carefully to them.
- In 2013, compared with English speakers, adults speaking Spanish or another language at home were significantly less likely to:
Provider-Patient Communication in Home Health Care
Provider-patient communication among adults receiving home health care, by race/ethnicity, 2013
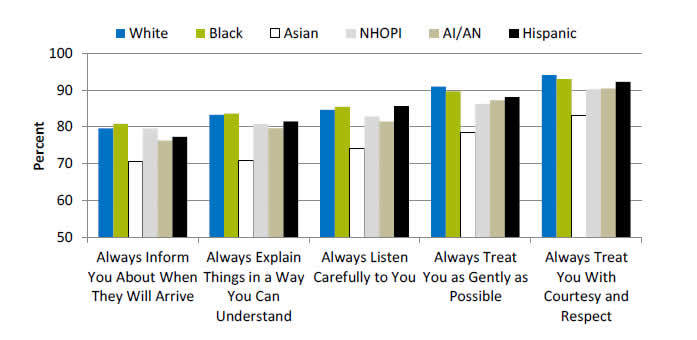
| Race / Ethnicity | Always Inform You About When They Will Arrive | Always Explain Things in a Way You Can Understand | Always Listen Carefully to You | Always Treat You as Gently as Possible | Always Treat You With Courtesy and Respect |
|---|---|---|---|---|---|
| AI/AN | 76.2 | 79.5 | 81.4 | 87.2 | 90.4 |
| Asian | 70.5 | 70.7 | 74.1 | 78.4 | 83.0 |
| Black | 80.8 | 83.6 | 85.5 | 89.6 | 93.0 |
| NHOPI | 79.5 | 80.7 | 82.7 | 86.2 | 90.1 |
| White | 79.5 | 83.2 | 84.6 | 90.9 | 94.1 |
| Hispanic | 77.2 | 81.4 | 85.6 | 88.1 | 92.2 |
Key: NHOPI = Native Hawaiian or Other Pacific Islander; AI/AN = American Indian or Alaska Native.
Source: Centers for Medicare & Medicaid Services, Home Health Care CAHPS (Consumer Assessment of Healthcare Providers and Systems) Survey, 2013.
Denominator: Adults who had at least two visits from a Medicare-certified home health agency during a 2-month look-back period.
Note: Patients receiving hospice care and those who had "maternity" as the primary reason for receiving home health care are excluded.
- Groups With Disparities:
- In 2013, among home health care patients, compared with Whites:
- Asians, American Indians and Alaska Natives (AI/ANs), and Hispanics were significantly less likely to always be informed about when their provider would arrive.
- Asians, Native Hawaiians and Other Pacific Islanders (NHOPIs), AI/ANs, and Hispanics were significantly less likely to always have things explained in a way that was easy to understand.
- Asians, NHOPIs, and AI/ANs were significantly less likely to always be listened to carefully.
- Blacks, Asians, NHOPIs, AI/ANs, and Hispanics were significantly less likely to always be treated as gently as possible.
- Blacks, Asians, NHOPIs, AI/ANs, and Hispanics were significantly less likely to always be treated with courtesy and respect.
- In 2013, among home health care patients, compared with Whites:
Providers Asking for Patient's Help With Treatment Decisions
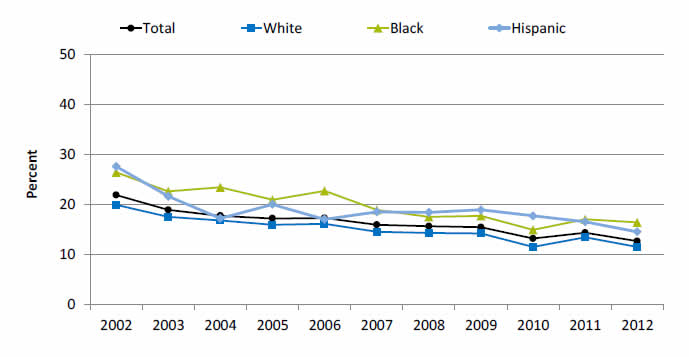
People with a usual source of care whose health providers sometimes or never asked for the patient’s help to make treatment decisions, by race/ethnicity, 2002-2012
| Race/Ethnicity | 2002 | 2003 | 2004 | 2005 | 2006 | 2007 | 2008 | 2009 | 2010 | 2011 | 2012 |
|---|---|---|---|---|---|---|---|---|---|---|---|
| Total | 21.9 | 18.9 | 17.7 | 17.2 | 17.3 | 15.9 | 15.6 | 15.4 | 13.2 | 14.3 | 12.7 |
| White | 19.9 | 17.5 | 16.8 | 15.9 | 16.1 | 14.5 | 14.3 | 14.2 | 11.5 | 13.4 | 11.5 |
| Black | 26.4 | 22.6 | 23.4 | 20.9 | 22.7 | 18.9 | 17.5 | 17.7 | 14.9 | 17 | 16.4 |
| Hispanic | 27.6 | 21.6 | 17.2 | 20 | 17 | 18.5 | 18.4 | 18.9 | 17.7 | 16.5 | 14.5 |
Source: Agency for Healthcare Research and Quality, Medical Expenditure Panel Survey, 2002-2012.
Note: For this measure, lower rates are better.
- Trends: Significant improvements were observed from 2002 to 2012:
- Total: 21.9% to 12.7%.
- Whites: 19.9% to 11.5%.
- Blacks: 26.4% to 16.4%.
- Hispanics: 27.6% to 14.5%.
- Groups With Disparities:
- In all years, Blacks were significantly less likely than Whites to be involved in their treatment decisions.
- In all years except 2004 and 2006, Hispanics were significantly less likely than Whites to be involved in their treatment decisions.
Hospice Care
Hospice patients who received the right amount of help for feelings of anxiety or sadness and who received care consistent with their stated end-of-life wishes, by race/ethnicity, 2008-2013

Left Graph (Help for Anxiety or Sadness):
| Race/Ethnicity | 2008 | 2009 | 2010 | 2011 | 2012 | 2013 |
|---|---|---|---|---|---|---|
| Total | 90.3 | 90.6 | 90.5 | 90.2 | 90.6 | 90.6 |
| White | 91.2 | 91.6 | 91.3 | 91.1 | 91.5 | 91.5 |
| Black | 86 | 85.5 | 85.9 | 86 | 84.6 | 85.2 |
| Hispanic | 85.3 | 85.7 | 86.8 | 85.7 | 87 | 85 |
Right Graph (Care Consistent With Wishes):
| Race/Ethnicity | 2008 | 2009 | 2010 | 2011 | 2012 | 2013 |
|---|---|---|---|---|---|---|
| Total | 94.2 | 94.6 | 94.4 | 94.6 | 94.8 | 94.8 |
| White | 94.7 | 95.1 | 94.8 | 95.3 | 95.5 | 95.6 |
| Black | 87.8 | 89.2 | 90.3 | 89.4 | 89.7 | 89.9 |
| Hispanic | 88.8 | 89.9 | 89 | 88.7 | 89.5 | 88.7 |
Source: National Hospice and Palliative Care Organization, Family Evaluation of Hospice Care Survey, 2008-2013.
- Help for Anxiety or Sadness:
- Trends: From 2008 to 2013, there were no statistically significant changes by race/ethnicity in the percentage of hospice patients who received the right amount of help for feelings of anxiety or sadness.
- Groups With Disparities: In 2013, Hispanics and Blacks were significantly less likely than Whites to receive the right amount of help for feelings of anxiety or sadness.
- Care Consistent With Stated Wishes:
- Trends: From 2008 to 2013, the percentage of hospice patients age 65 and over who received care consistent with their stated end-of-life wishes significantly improved from 94.4% to 95.1% (data not shown). From 2008 to 2013, White (94.7% to 95.6%) and Black (87.8% to 89.9%) hospice patients showed significant improvement, whereas Hispanics showed no statistically significant changes during this period.
- Groups With Disparities: In 2013, Black and Hispanic hospice patients were significantly less likely than White patients to receive care consistent with their stated end-of-life wishes.
AHRQ Health Care Innovations in Hospice Care
- Location: Boca Raton, Florida.
- Population: Hispanic patients and families.
- Intervention: Abriendo Puertas featured cultural competency training for all staff; a dedicated, bilingual care team; and outreach to educate local Hispanics and their physicians about the availability and purpose of hospice services.
- Outcomes: Enhanced awareness of, attitudes about, and willingness to accept hospice services among Hispanics, as well as improved cultural competency among staff.
Return to National Quality Strategy Priorities
Return to Contents


