Health Insurance Premiums and Out-of-Pocket Medical Expenditures Above 10% of Family Income
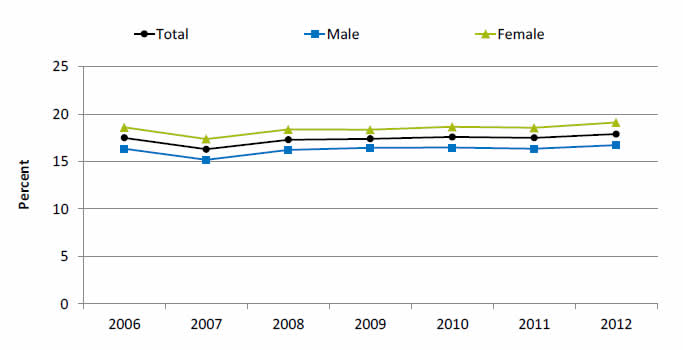
People under age 65 whose family's health insurance premiums and out-of-pocket medical expenditures were more than 10% of total family income, by sex, 2006-2012
| Sex | 2006 | 2007 | 2008 | 2009 | 2010 | 2011 | 2012 |
|---|---|---|---|---|---|---|---|
| Total | 17.5 | 16.3 | 17.3 | 17.4 | 17.6 | 17.5 | 17.9 |
| Male | 16.3 | 15.2 | 16.2 | 16.4 | 16.5 | 16.4 | 16.7 |
| Female | 18.6 | 17.4 | 18.4 | 18.4 | 18.7 | 18.5 | 19.1 |
Source: Agency for Healthcare Research and Quality, Medical Expenditure Panel Survey, 2006-2012.
Note: For this measure, lower rates are better.
- Importance: Health care expenses that exceed 10% of family income are a marker of financial burden for families. Chevan and colleagues (2015) found that being female was one of the factors that increased the odds of out-of-pocket expenditures for physical therapy services.
- Overall Rate: In 2012, the total percentage of people with out-of-pocket expenditures greater than 10% of income was 17.9%.
- Trends: From 2006 to 2012, there were no statistically significant changes among the total population or among males and females.
- Groups With Disparities:
- In all years from 2006 to 2012, the percentage of people with out-of-pocket expenditures greater than 10% of income was higher for females than for males.
- In 2012, females (19.1%) were more likely to have health insurance premiums and out-of-pocket medical expenditures more than 10% of total family income compared with males (16.7%).
Females With Health Insurance Premiums and Out-of-Pocket Medical Expenditures Above 10% of Family Income
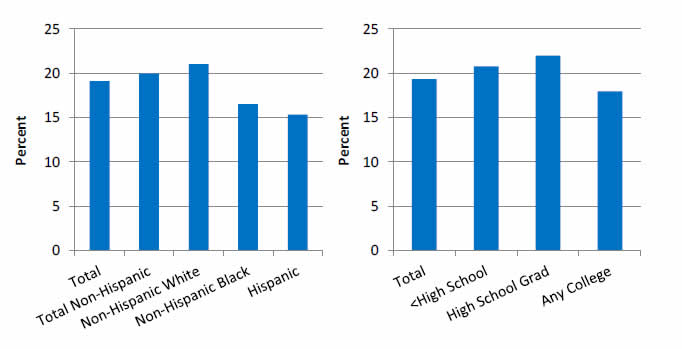
Females under age 65 whose family’s health insurance premiums and out-of-pocket medical expenditures were more than 10% of total family income, by race/ethnicity and education, 2012
Source: Agency for Healthcare Research and Quality, Medical Expenditure Panel Survey, 2012.
Note: For this measure, lower rates are better.
- Overall Rate: In 2012, 19% of females had health insurance premiums and out-of-pocket medical expenditures that were more than 10% of total family income.
- Groups With Disparities:
- In 2012, non-Hispanic Black (16.5%) and Hispanic females (15.3%) were less likely to have health insurance premiums and out-of-pocket medical expenditures that were more than 10% of total family income compared with non-Hispanic White females (21.1%).
- Women with less than a high school education (20.8%) and a high school education (22%) were more likely to have health insurance premiums and out-of-pocket expenditures that were more than 10% of total family income compared with women with any college (18%).
Financial or Insurance Reasons for Not Having a Usual Source of Care
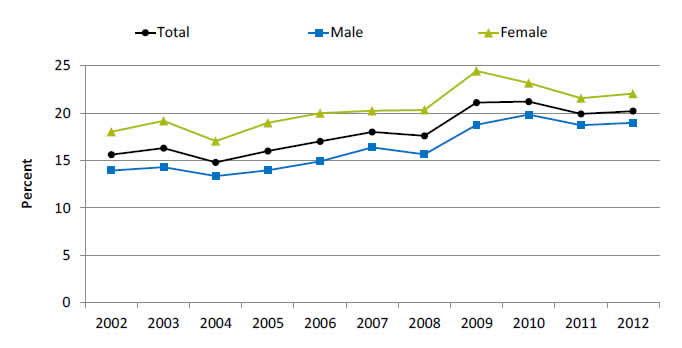
People without a usual source of care who indicate a financial or insurance reason for not having a source of care, by sex, 2002-2012
| Sex | 2002 | 2003 | 2004 | 2005 | 2006 | 2007 | 2008 | 2009 | 2010 | 2011 | 2012 |
|---|---|---|---|---|---|---|---|---|---|---|---|
| Total | 15.6 | 16.3 | 14.8 | 16 | 17 | 18 | 17.6 | 21.1 | 21.2 | 19.9 | 20.2 |
| Male | 13.9 | 14.3 | 13.4 | 14.0 | 14.9 | 16.4 | 15.6 | 18.8 | 19.8 | 18.7 | 19.0 |
| Female | 18.0 | 19.2 | 17.0 | 19.0 | 20.0 | 20.2 | 20.3 | 24.4 | 23.2 | 21.6 | 22.0 |
Source: Agency for Healthcare Research and Quality, Medical Expenditure Panel Survey, 2002-2012.
Note: For this measure, lower rates are better.
- Importance: High-quality health care is facilitated by having a regular provider, but some Americans may not be able to afford one. It is estimated that women without a usual source of care do not receive recommended cancer screening (Sabatino, et al., 2015). Predictors for not having a usual source of care include lack of insurance, less educational attainment, and low income.
- Overall Rate: In 2012, 20.2% of people without a usual source of care indicated a financial or insurance reason for not having a source of care.
- Trends:
- From 2002 to 2012, the percentage of people without a usual source of care who indicated a financial or insurance reason for not having a source of care worsened overall (from 15.6% to 20.2%) and for both sexes (from 13.9% to 19% for males and from 18% to 22% for females).
- Groups With Disparities:
- From 2002 to 2012, females were more likely to be without a usual source of care and indicate a financial or insurance reason for not having a source of care than their male counterparts.
- In 2012, females (22%) were more likely to be without a usual source of care and indicate a financial or insurance reason for not having a source of care than males (19%).
Females With Financial or Insurance Reasons for Not Having a Usual Source of Care
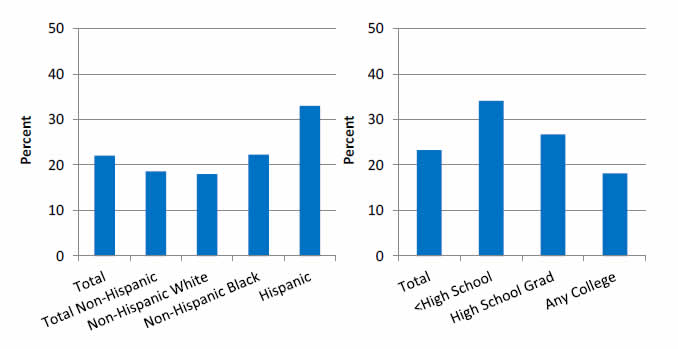
Females without a usual source of care who indicate a financial or insurance reason for not having a source of care, by race/ethnicity and education, 2012
Source: Agency for Healthcare Research and Quality, Medical Expenditure Panel Survey, 2012.
Note: For this measure, lower rates are better. White and Black are non-Hispanics. Hispanic includes all races.
- Overall Rate: In 2012, 22% of females without a usual source of care indicated a financial or insurance reason for not having a source of care.
- Groups With Disparities:
- In 2012, Hispanic females (33%) without a usual source of care were more likely to indicate a financial or insurance reason for not having a usual source of care compared with non-Hispanic White females (18%).
- Hispanic females were the group with the highest percentage of people without a usual source of care due to finances or insurance.
- In 2012, women without a usual source of care with less than a high school education (34.1%) and those with a high school education (26.7%) were more likely to indicate a financial or insurance reason for not having a source of care compared with those with any college (18.2%).
Financial or Insurance Reasons for Difficulty Getting Care
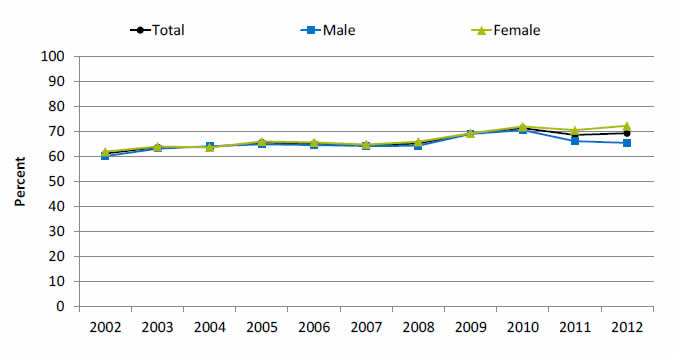
People unable to get or delayed in getting needed medical care, dental care, or prescription medicines who indicate financial or insurance reasons, by sex, 2002-2012
| Sex | 2002 | 2003 | 2004 | 2005 | 2006 | 2007 | 2008 | 2009 | 2010 | 2011 | 2012 |
|---|---|---|---|---|---|---|---|---|---|---|---|
| Total | 61.2 | 63.7 | 63.8 | 65.6 | 65.2 | 64.6 | 65.2 | 69.2 | 71.4 | 68.7 | 69.3 |
| Male | 60.2 | 63.2 | 64.1 | 64.9 | 64.6 | 64.2 | 64.3 | 69.0 | 70.6 | 66.2 | 65.5 |
| Female | 62.0 | 64.0 | 63.6 | 66.1 | 65.7 | 64.8 | 65.9 | 69.3 | 72.0 | 70.5 | 72.3 |
Source: Agency for Healthcare Research and Quality, Medical Expenditure Panel Survey, 2002-2012.
- Importance: Some Americans cannot afford all the care they need. Therefore, many delay getting needed health care, which could exacerbate health conditions. Unaffordable health care has been cited as a significant factor precluding women veterans from obtaining needed medical care (Washington, et al., 2011).
- Overall Rate: In 2012, among people who were unable to get or delayed getting needed medical care, dental care, or prescription medicines, 69.3% indicated financial or insurance reasons.
- Trends:
- From 2002 to 2010, among people unable to get or delayed in getting needed medical care, the percentage who cited financial or insurance reasons increased, but by 2011 the percentage decreased.
- From 2002 to 2012, the percentage worsened for females (from 62% to 72.3%) and for the total population (from 61.2% to 69.3%).
- Groups With Disparities: In 2012, the percentage of females unable to get or delayed in getting health care who indicated financial or insurance reasons was higher than for males. Among those who were unable to get or delayed in getting needed care, approximately 72% of females cited financial or insurance reasons compared with 65.5% of males.
Females With Financial or Insurance Reasons for Difficulty Getting Care
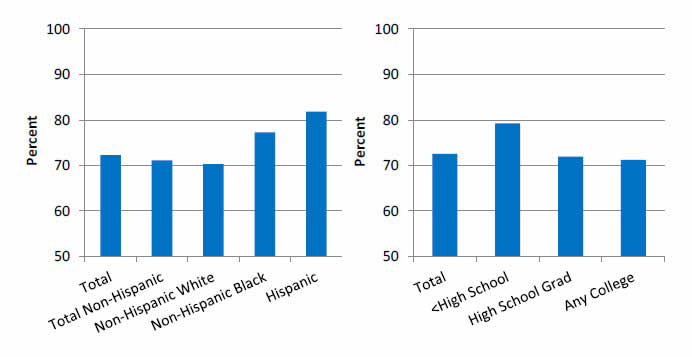
Females unable to get or delayed in getting needed medical care, dental care, or prescription medicines who indicate financial or insurance reasons, by race/ethnicity and education, 2012
Source: Agency for Healthcare Research and Quality, Medical Expenditure Panel Survey, 2012.
- Overall Rate: In 2012, among females unable to get or delaying in getting needed medical care, dental care, or prescription medicines, approximately 72% cited financial or insurance reasons.
- Groups With Disparities:
- In 2012, among females unable to get or delayed in getting needed health care, Hispanic females (81.8%) and non-Hispanic Black females (77.3%) were more likely to indicate financial or insurance reasons than non-Hispanic White females (70.3%).
- In 2012, among women unable to get or delayed in getting needed health care, those with less than a high school education (79.2%) were more likely to indicate financial or insurance reasons compared with those with any college (71.2%).


