Infant Mortality
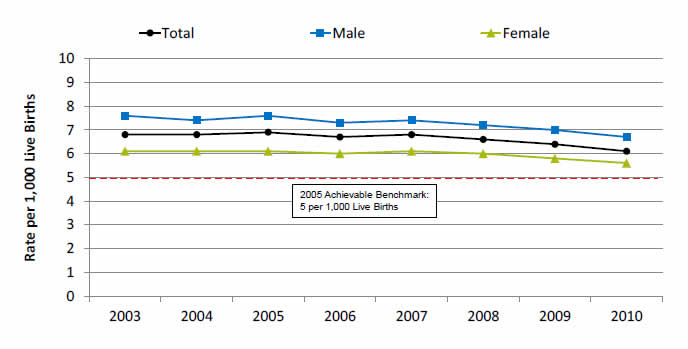
Infant mortality per 1,000 live births, all birth weights, by sex, 2003-2010

| Sex | 2003 | 2004 | 2005 | 2006 | 2007 | 2008 | 2009 | 2010 |
|---|---|---|---|---|---|---|---|---|
| Total | 6.8 | 6.8 | 6.9 | 6.7 | 6.8 | 6.6 | 6.4 | 6.1 |
| Male | 7.6 | 7.4 | 7.6 | 7.3 | 7.4 | 7.2 | 7.0 | 6.7 |
| Female | 6.1 | 6.1 | 6.1 | 6.0 | 6.1 | 6.0 | 5.8 | 5.6 |
2005 Acheivable Benchmark: 5 per 1,000 Live Births.
Source: Centers for Disease Control and Prevention, National Center for Health Statistics, National Vital Statistics System—Linked Birth and Infant Death Data.
Note: For this measure, lower rates are better.
- Importance: Infant mortality, or the death of a child within the first year, is an important indicator of population health that reflects the well-being of mothers and families, including the broader socioeconomic and environmental factors that influence one’s health and access to health care. Approximately two-thirds of infant deaths occur in the neonatal period or within 1 month and one-third occur in the postneonatal period from 1 month to less than 1 year. Neonatal mortality is predominantly related to prematurity, congenital anomalies, and other perinatal conditions. Postneonatal mortality is mostly attributable to sudden unexpected infant death (SUID), congenital anomalies, infection, and injury (Child Health USA, 2014).
- Overall Rate: In 2010, the infant mortality rate was 6.1 per 1,000 live births.
- Trends: From 2003 to 2010, the infant mortality rate per 1,000 live births for all weights improved overall (from 6.8 to 6.1), for males (from 7.6 to 6.7), and for females (from 6.1 to 5.6).
- Groups With Disparities: In all years, the infant mortality rate per 1,000 live births was lower for females than for males.
- Achievable Benchmark:
- The 2005 top 5 State achievable benchmark for infant mortality was 5 per 1,000 live births. The top 5 States that contributed to the achievable benchmark are Massachusetts, Minnesota, New Jersey, Utah, and Washington.
- At the current rate of change, the total population could achieve the benchmark in 12 years, males in 15 years, and females in 10 years.
Infant Mortality per 1,000 Female Live Births
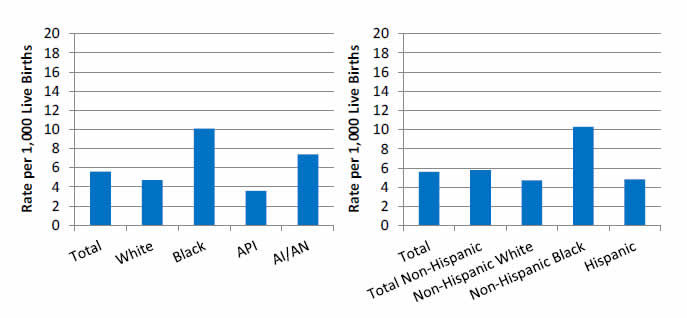
Infant mortality per 1,000 female live births, all birth weights, by race and ethnicity, 2010

Source: Centers for Disease Control and Prevention, National Center for Health Statistics, National Vital Statistics System—Linked Birth and Infant Death Data.
Note: For this measure, lower rates are better.
- Overall Rate: In 2010, the total infant mortality rate among females was 5.6 per 1,000 live births.
- Groups With Disparities:
- In 2010, the infant mortality rate per 1,000 live births was higher for American Indian and Alaska Native (7.4) and Black infants (10.1) compared with White infants (4.7).
- The rate was lower for API infants (3.6) compared with White infants.
- In 2010, the infant mortality rate per 1,000 live births was worse for non-Hispanic Black (10.3 per 1,000) and total non-Hispanic (5.8) compared with non-Hispanic White infants (4.7).


