Disparities in Quality
Disparities in measures of quality between males and females

Key: n = number of measures.
Better = Population received better quality of care than reference group (males).
Same = Population and reference group received about the same quality of care.
Worse = Population received worse quality of care than reference group.
Note: For each measure, the most recent data year available was analyzed. These data represent 2012-2013.
- Females received better quality of care than males for 29% (74 of 253) of the measures.
- Females received worse quality of care than males for 16% (41 of 253) of the measures.
- There were no statistically significant differences between males and females for 55% (138 of 253) of the measures.
Disparities in Quality by NQS Priorities and Access
Disparities in quality of care measures between males and females, by 4 NQS priorities and Access
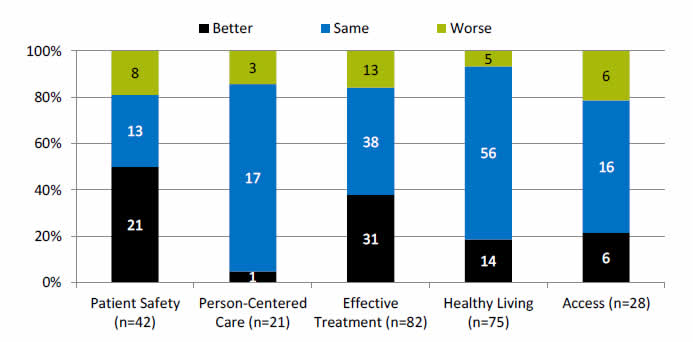
Key: n = number of measures.
Better = Population received better quality of care than reference group (males).
Same = Population and reference group received about the same quality of care.
Worse = Population received worse quality of care than reference group.
- Overall: Females received better care than males for Patient Safety (50%) and Effective Treatment (38%) measures.
- Patient Safety measures: Females received better care than males for 50% of the measures, the same for 31%, and worse for 19%.
- Person-Centered Care measures: Females received better care than males for 5% of the measures, the same for 81%, and worse for 14%.
- Effective Treatment measures: Females received better care than males for 38% of the measures, the same for 46%, and worse for 16%.
- Healthy Living measures: Females received better care than males for 19% of the measures, the same for 75%, and worse for 6%.
- Access measures: Females received better care than males for 21% of the measures, the same for 58%, and worse for 21%.
- There are insufficient numbers of reliable measures of Care Coordination and Care Affordability to summarize in this way.
Change in Disparities
Change in disparities in measures of quality between males and females
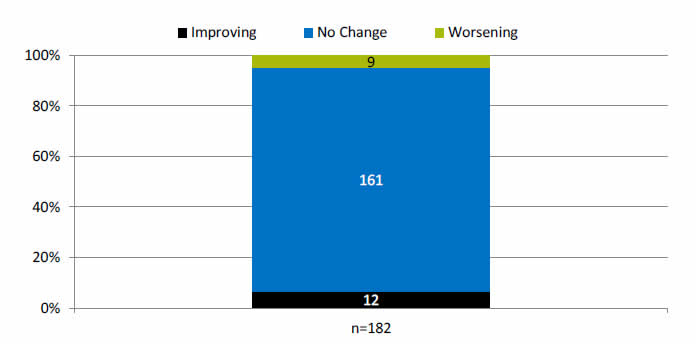
Key: n = number of measures.
Improving = Disparity is getting smaller at a rate greater than 1% per year.
No change = Disparity is not changing or is changing at a rate less than 1% per year.
Worsening = Disparity is getting larger at a rate greater than 1% per year.
Note: For each measure, the earliest and most recent data year available were analyzed through 2012-2013.
- Disparities between males and females were improving (getting smaller) for 7% (12 of 182) of the measures.
- Disparities between males and females were worsening (getting larger) for 5% (9 of 182) of the measures.
- Disparities between males and females were not changing for 88% (161 of 182) of the measures.
Change in Disparities by NQS Priorities and Access
Change in disparities between males and females, by 4 NQS priorities and Access
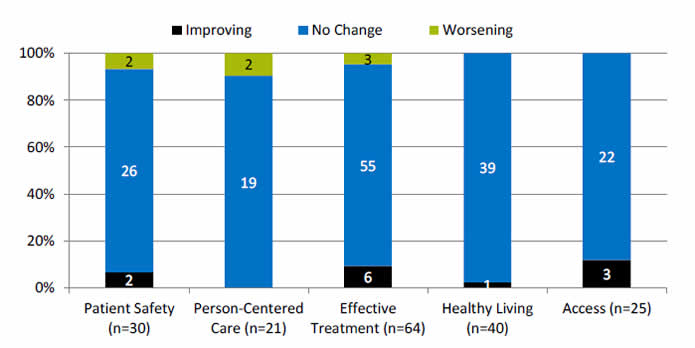
Key: n = number of measures.
Improving = Disparity is getting smaller at a rate greater than 1% per year.
No change = Disparity is not changing or is changing at a rate less than 1% per year.
Worsening = Disparity is getting larger at a rate greater than 1% per year.
- Overall: There were no statistically significant changes in disparities between males and females for nearly 90% of the measures.
- Patient Safety measures: Disparities between males and females were improving for 7% of the measures, not changing for 86%, and worsening for 7%.
- Person-Centered Care measures: Disparities between males and females were worsening for 10% of the measures and not changing for 90%.
- Effective Treatment measures: Disparities between males and females were improving for 9% of the measures, not changing for 86%, and worsening for 5%.
- Healthy Living measures: Disparities between males and females were worsening for 3% of the measures and not changing for 97%.
- Access measures: Disparities between males and females were improving for 12% of the measures and not changing for 88%.
- There are insufficient numbers of reliable measures of Care Coordination and Care Affordability to summarize in this way.
Trends in Quality
Trends in measures of quality for females
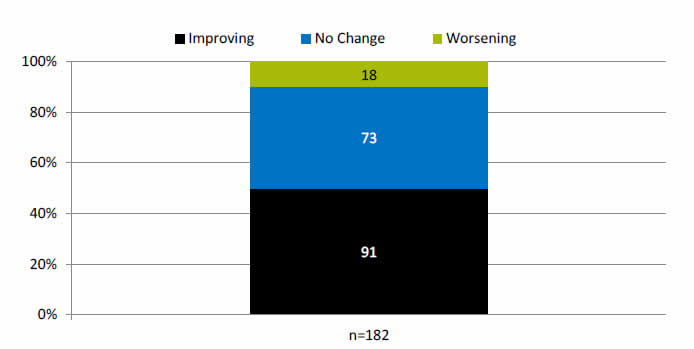
Key: n = number of measures.
Improving = Quality is going in a positive direction at an average annual rate greater than 1% per year.
No Change = Quality is not changing or is changing at an average annual rate less than 1% per year.
Worsening = Quality is going in a negative direction at an average annual rate greater than 1% per year.
Note: For each measure, the earliest and most recent data year available were analyzed through 2012 to 2013.
- The quality of care for women:
- Improved for 50% (91 out of 182) of the measures.
- Worsened for 10% (18 out of 182) of the measures.
- Did not change for 40% (73 out 182) of the measures.
Trends in Quality
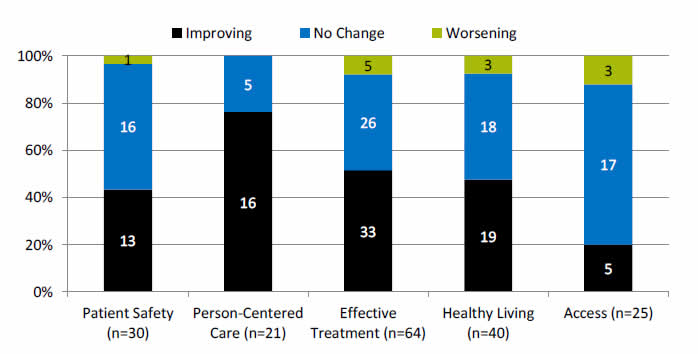
Trends in measures of quality for females, by 4 NQS priorities and Access
Key: n = number of measures.
Improving = Quality is going in a positive direction at an average annual rate greater than 1% per year.
No Change = Quality is not changing or is changing at an average annual rate less than 1% per year.
Worsening = Quality is going in a negative direction at an average annual rate greater than 1% per year.
- Overall: More measures of quality of care for women showed improvement for Person-Centered Care (76% of the measures), Effective Treatment (52%), Healthy Living (48%), and Patient Safety (43%) compared with Access (20%).
- Patient Safety measures: Quality of care for women was improving for 43% of the measures, not changing for 53%, and worsening for 4% of the measures.
- Person-Centered care measures: Quality of care for women was improving for 76% of the measures and not changing for 24%.
- Effective Treatment measures: Quality of care for women was improving for 52% of the measures, not changing for 40%, and worsening for 8%.
- Healthy Living measures: Quality of care for women was improving for 48% of the measures, not changing for 45%, and worsening for 7%.
- Access measures: Quality of care for women was improving for 20% of the measures, not changing for 68%, and worsening for 12%.
- There are insufficient numbers of reliable measures of Care Coordination and Care Affordability to summarize in this way.


