Deaths per 1,000 Hospital Admissions With Acute Myocardial Infarction
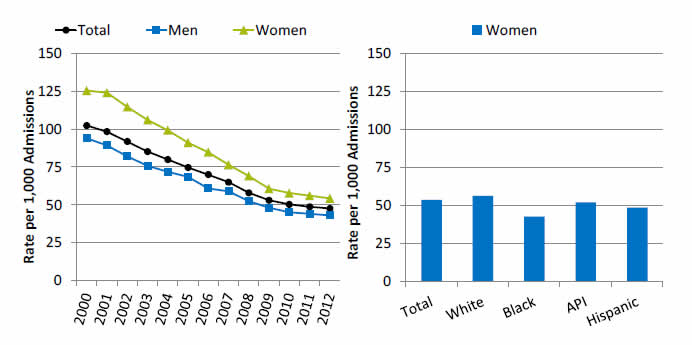
Deaths per 1,000 hospital admissions with acute myocardial infarction (AMI), age 18 and over, by sex, 2000-2012, and by race/ethnicity, 2012

Left Graph (Sex):
| Year | Total | Men | Women |
|---|---|---|---|
| 2000 | 102.4 | 94.0 | 125.4 |
| 2001 | 98.3 | 89.2 | 124.0 |
| 2002 | 91.8 | 82.0 | 114.6 |
| 2003 | 85.2 | 75.8 | 106.1 |
| 2004 | 79.9 | 71.7 | 99.2 |
| 2005 | 74.7 | 68.5 | 91.1 |
| 2006 | 70.0 | 60.8 | 84.8 |
| 2007 | 65.0 | 58.9 | 76.4 |
| 2008 | 57.9 | 52.3 | 69.0 |
| 2009 | 53.0 | 48.0 | 60.7 |
| 2010 | 50.2 | 45.1 | 57.8 |
| 2011 | 48.7 | 44.1 | 56.0 |
| 2012 | 47.6 | 43.0 | 54.3 |
Right Chart (Women by Race/Ethnicity):
- Total - 53.7.
- White- 56.1.
- Black - 42.4.
- API - 51.8.
- Hispanic - 48.3.
Key: API = Asian or Pacific Islander.
Source: Agency for Healthcare Research and Quality (AHRQ), Healthcare Cost and Utilization Project, 2000-2011 Nationwide Inpatient Sample, 2012 State Inpatient Databases disparities analysis files, and AHRQ Quality Indicators, version 4.4.
Note: White, Black, and API are non-Hispanic. Hispanic includes all races.
- Importance: Cardiovascular disease (CVD) is the number one killer of women worldwide, accounting for one-third of all deaths. In the United States, more than 38 million women are living with CVD, and the at-risk population is even larger (Collins-Sharp, 2012). Heart attack, or acute myocardial infarction, is a common life-threatening condition that requires rapid recognition and efficient treatment in a hospital to reduce the risk of serious heart damage and death (Collins-Sharp, 2012).
- Trends:
- From 2000 to 2012, the rate of deaths per 1,000 hospital admissions with acute myocardial infarction improved overall and for both men and women.
- The rate for women decreased from 125.4 to 54.3 per 1,000 admissions.
- The rate for men decreased from 94 to 43 per 1,000 admissions.
- Groups With Disparities:
- In all years from 2000 to 2012, women had higher rates of death per 1,000 hospital admissions with acute myocardial infarction than men.
- In 2012, Black and Hispanic women had lower rates of death than White women.
Suicide Deaths
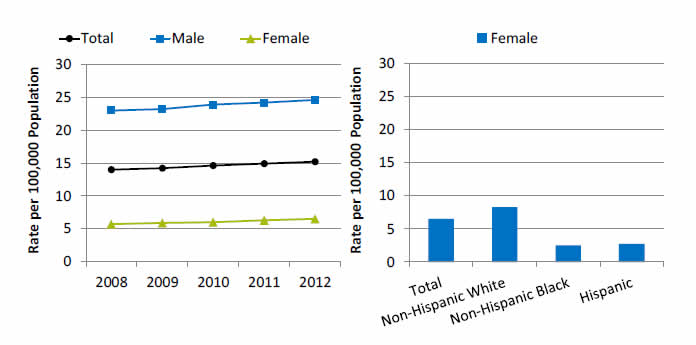
Suicide deaths per 100,000 population, by sex, 2008-2012, and by race/ethnicity, 2012

Left Graph (Sex):
| Year | Total | Male | Female |
|---|---|---|---|
| 2008 | 14 | 23 | 5.7 |
| 2009 | 14.2 | 23.2 | 5.9 |
| 2010 | 14.6 | 23.9 | 6 |
| 2011 | 14.9 | 24.2 | 6.3 |
| 2012 | 15.2 | 24.6 | 6.5 |
Right Chart (Women by Race/Ethnicity):
- Total- 6.5.
- Non-Hispanic White - 8.3.
- Non-Hispanic Black - 2.5.
- Hispanic - 2.7.
Source: Centers for Disease Control and Prevention, National Vital Statistics System, 2008-2012.
- Importance: According to the Centers for Disease Control and Prevention (Xu, et al., 2014), the rate for the top 10 leading causes of death has decreased or held steady, except the 10th leading cause of death in the United States, suicide. Rates of attempted suicide vary considerably among demographic groups. While males are 4 times more likely than females to die by suicide, females attempt suicide 3 times as often as males. The economic cost of suicide death in the United States was estimated in 2010 to be more than $44 billion annually. With the burden of suicide falling most heavily on adults of working age, the cost to the economy results almost entirely from lost wages and work productivity. In 2013 (the most recent year for which full data are available), 41,149 suicides were reported (CDC WISQARS, 2013; American Foundation for Suicide Prevention, 2015).
- Trends: From 2008 to 2012, suicide deaths among females showed a statistically significant increase. There were no statistically significant changes overall or among males.
- Groups With Disparities:
- In 2012, overall, females had lower rates of suicide deaths than males (nearly 4 times as low).
- Females from all ethnic groups had lower rates of suicide deaths than males.
- White females were more than 3 times as likely as Black females to die from suicide.
Cancer Deaths
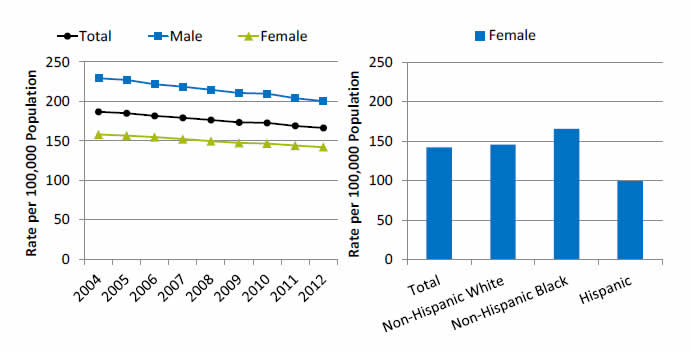
Cancer deaths per 100,000 population per year for all cancers, by sex, 2004-2012, and by race/ethnicity, 2012

Left Graph (Sex):
| Year | Total | Male | Female |
|---|---|---|---|
| 2004 | 186.8 | 229.5 | 158.2 |
| 2005 | 185.1 | 227.2 | 156.7 |
| 2006 | 181.8 | 221.7 | 154.7 |
| 2007 | 179.3 | 218.8 | 152.3 |
| 2008 | 176.4 | 214.9 | 149.6 |
| 2009 | 173.5 | 210.9 | 147.4 |
| 2010 | 172.8 | 209.9 | 146.7 |
| 2011 | 169 | 204 | 144 |
| 2012 | 166.5 | 200.3 | 142.1 |
Right Chart (Women by Race/Ethnicity):
- Total - 142.1.
- Non-Hispanic White - 146.
- Non-Hispanic Black - 165.7.
- Hispanic - 99.3.
Source: Centers for Disease Control and Prevention, National Vital Statistics System.
- Importance: In 2015, there will be an estimated 1,658,370 new cancer cases diagnosed and 589,430 cancer deaths in the United States (ACS, 2015). AHRQ estimates that the direct medical costs (total of all health care expenditures) for cancer in the United States in 2011 were $88.7 billion.
- Trends: From 2004 to 2012, cancer deaths overall and among both females and males showed statistically significant improvement.
- Groups With Disparities:
- In 2012, overall, females had lower rates of cancer deaths per 100,000 hospital admissions than males.
- Females from all ethnic groups had lower rates of cancer deaths than males.


