Inappropriate Prescriptions for Older Adults
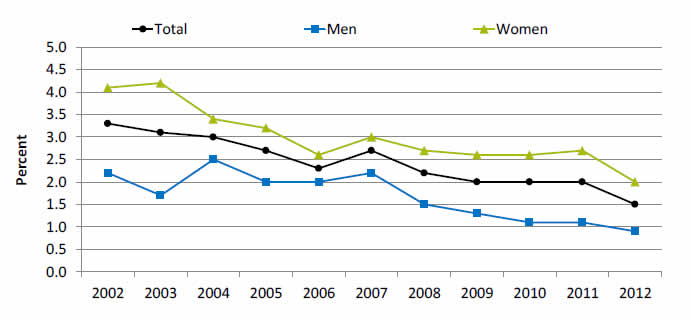
Adults age 65 and over with at least 1 prescription from 11 medications that should be avoided in older adults, by sex, 2002-2012

| Year | Total | Women | Men |
|---|---|---|---|
| 2002 | 3.3 | 4.1 | 2.2 |
| 2003 | 3.1 | 4.2 | 1.7 |
| 2004 | 3 | 3.4 | 2.5 |
| 2005 | 2.7 | 3.2 | 2 |
| 2006 | 2.3 | 2.6 | 2 |
| 2007 | 2.7 | 3 | 2.2 |
| 2008 | 2.2 | 2.7 | 1.5 |
| 2009 | 2 | 2.6 | 1.3 |
| 2010 | 2 | 2.6 | 1.1 |
| 2011 | 2 | 2.7 | 1.1 |
| 2012 | 1.5 | 2 | 0.9 |
Source: Agency for Healthcare Research and Quality, Medical Expenditure Panel Survey, 2002-2012.
Note: For this measure, lower rates are better. Prescription medications received include all prescribed medications initially purchased or otherwise obtained as well as any refills. For more information on inappropriate medications and examples of the 11 medications that should be avoided in older adults, see American Geriatrics Society 2012 Beers Criteria Update Expert Panel. American Geriatrics Society updated Beers Criteria for potentially inappropriate medication use in older adults. J Am Geriatr Soc 2012 Apr;60(4):616-31.
- Importance: Some drugs that are prescribed for older patients are known to be potentially harmful for this age group (Pretorius, et al., 2013).
- Overall Rate: In 2012, 1.5% of adults age 65 and over were prescribed at least 1 medication from 11 medications that should be avoided in older adults. In 2012, the percentage was 0.9% for men and 2% for women (more than double).
- Trends:
- From 2002 to 2012, the percentage of adults age 65 and over who were prescribed at least 1 medication from 11 medications that should be avoided in older adults decreased from 3.3% to 1.5%.
- From 2002 to 2012, the percentage of men age 65 and over who were prescribed at least 1 medication from 11 medications that should be avoided in older adults decreased from 2.2% to 0.9% and the percentage of women for the same measure decreased from 4.1% to 2%.
- From 2002 to 2012, the percentage of adults age 65 and over who received potentially inappropriate prescription medications decreased overall and for all racial and ethnic groups and all income groups (data not shown).
- Groups With Disparities: In all years from 2002 to 2012, men were less likely than women to be prescribed at least 1 medication from 11 medications that should be avoided in older adults.
Postoperative Catheter-Associated Urinary Tract Infection
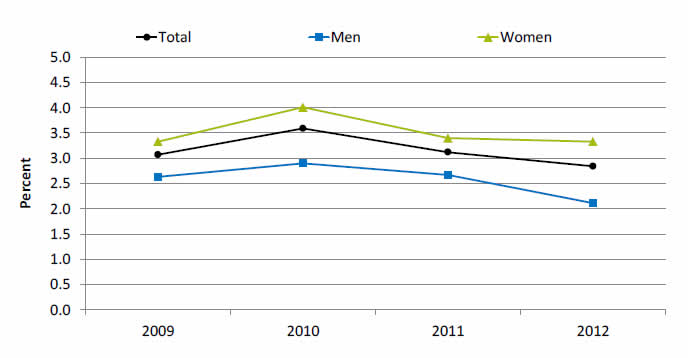
Adult surgery patients age 18 and over with postoperative catheter-associated urinary tract infection, by sex, 2009-2012

| Year | Total | Women | Men |
|---|---|---|---|
| 2009 | 3.1 | 3.3 | 2.6 |
| 2010 | 3.6 | 4.0 | 2.9 |
| 2011 | 3.1 | 3.4 | 2.7 |
| 2012 | 2.8 | 3.3 | 2.1 |
Source: Agency for Healthcare Research and Quality (AHRQ), 2009-2011 Nationwide Inpatient Sample, 2012 State Inpatient Databases quality analysis file, and AHRQ Quality Indicators, version 4.4.
- Importance: The urinary tract is a common site of healthcare-associated infections (HAIs) and an indicator of hospital patient safety. Urinary catheter use and specific comorbid conditions can increase the risk of developing a urinary tract infection (UTI). Approximately 40% of all HAIs are attributed to catheter-associated UTI (CAUTI) (Lo, et al., 2008).
- Overall Rate: In 2012, the percentage of women with CAUTI was 3.3%, and the percentage of men with CAUTI was 2.1%.
- Trends:
- In general, CAUTI percentages decreased overall from 3.6 in 2010 to 2.8 in 2012.
- From 2009 to 2012, there was no statistically significant change in the percentage of women with postoperative CAUTI.
- Groups With Disparities:
- From 2009 to 2012, the percentage of adults with postoperative CAUTI was higher for women compared with men.
- In 2012, women were 1.5% more likely to have a postoperative CAUTI than men.
Ambulatory Medical Care Visits Due to Adverse Effects of Care
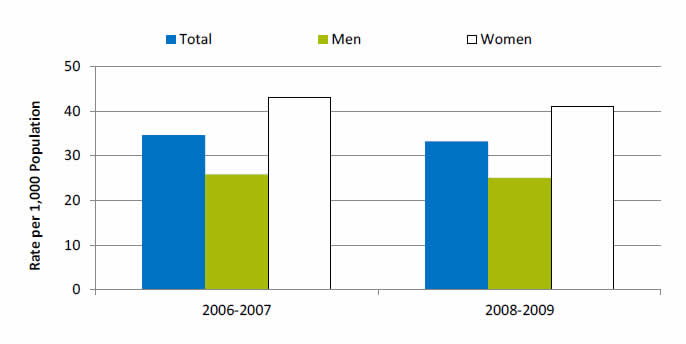
Adult ambulatory medical care visits due to adverse effects of medical care per 1,000 population, by sex, 2006-2007, 2008-2009

Source: Centers for Disease Control and Prevention, National Center for Health Statistics, National Ambulatory Medical Care Survey and National Hospital Ambulatory Medical Care Survey, 2006-2007 and 2008-2009.
Note: "Ambulatory care" includes visits to office-based physicians, hospital outpatient departments, and hospital emergency departments.
- Importance: Adverse effects of medical care can arise from medical and surgical procedures as well as from adverse drug reactions. Although patient safety initiatives focus mainly on inpatient hospital events, adverse effects of medical care are much more commonly treated at visits to outpatient settings, with more than 12 million such visits occurring annually. Providers treating adverse events in outpatient settings may include office-based physicians, hospital outpatient departments, and hospital emergency departments. Events treated in ambulatory settings may be less severe than those occurring in inpatient settings. Some adverse events, such as known side effects of appropriately prescribed medications, may be unavoidable, while others may be considered medical errors. Although the measure here does not distinguish between the two types of events, it provides an overall sense of the burden these events place on the population.
- Overall Rate: In 2008-2009, the rate of ambulatory care visits for adverse effects of medical care was 33.2 per 1,000 population.
- Groups With Disparities: From 2006 to 2009, the rate of ambulatory care visits for adverse effects of medical care was higher for women than for men.
Ambulatory Medical Care Visits Due to Adverse Effects of Care
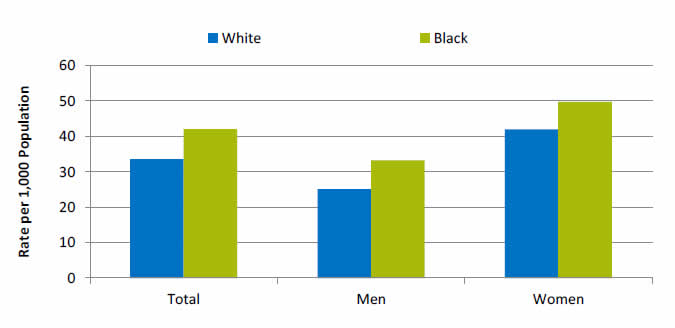
Adult ambulatory medical care visits due to adverse effects of medical care per 1,000 population, by race, stratified by sex, United States, 2008-2009

Source: Centers for Disease Control and Prevention, National Center for Health Statistics, National Ambulatory Medical Care Survey and National Hospital Ambulatory Medical Care Survey, 2008-2009.
- Groups With Disparities:
- In 2008-2009, Blacks had higher rates of ambulatory care visits for adverse effects of medical care compared with Whites.


