Hospice Care Consistent With End-of-Life Wishes
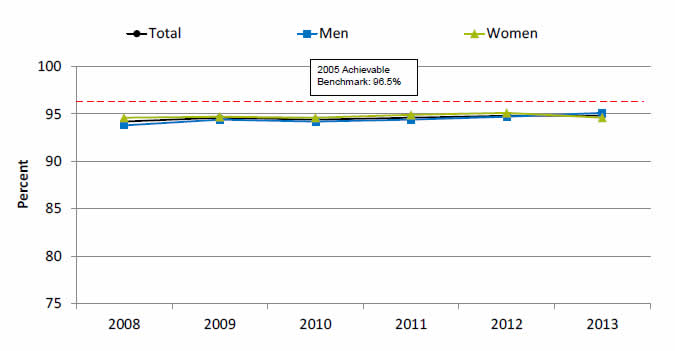
Adult hospice patients who received care consistent with their stated end-of-life wishes, by sex, 2008-2013

| Year | Total | Women | Men |
|---|---|---|---|
| 2008 | 94.2 | 94.6 | 93.8 |
| 2009 | 94.6 | 94.7 | 94.4 |
| 2010 | 94.4 | 94.6 | 94.2 |
| 2011 | 94.6 | 94.9 | 94.4 |
| 2012 | 94.8 | 95.1 | 94.7 |
| 2013 | 94.8 | 94.6 | 95.1 |
Benchmark: 96.5%.
Source: National Hospice and Palliative Care Organization, Family Evaluation of Hospice Care Survey, 2008-2013.
- Importance:
- Hospice care is generally delivered at the end of life to patients with a terminal illness or condition who desire palliative medical care.
- Hospice care also includes practical, psychosocial, and spiritual support for the patient and family. The goal of end-of-life care is to achieve a "good death," defined by the Institute of Medicine as “…free from avoidable distress and suffering for patients, families, and caregivers; in general accord with the patients' and families' wishes; and reasonably consistent with clinical, cultural, and ethical standards” (Field & Cassel, 1997).
- Overall Rate: From 2008 to 2013, the overall percentage of adult hospice patients who received care consistent with their stated end-of-life wishes remained constant around 94%.
- Trends: From 2008 to 2013, the percentage of female hospice patients who received care consistent with their stated end-of-life wishes improved in 3 of 5 years.
- Groups With Disparities: From 2008 to 2012, female hospice patients were more likely to receive care consistent with their stated end-of-life wishes compared to men.
- Achievable Benchmark:
- The 2008 top 5 State achievable benchmark for hospice patients who received care consistent with their stated end-of-life wishes was 96.5%. The top 5 States that contributed to the achievable benchmark are Maine, Minnesota, Mississippi, New Hampshire, and Tennessee.
- At the current rate of change, the total population could achieve the benchmark in 14 years, men in 9 years, and women in 12 years.
Poor Communication With Health Providers
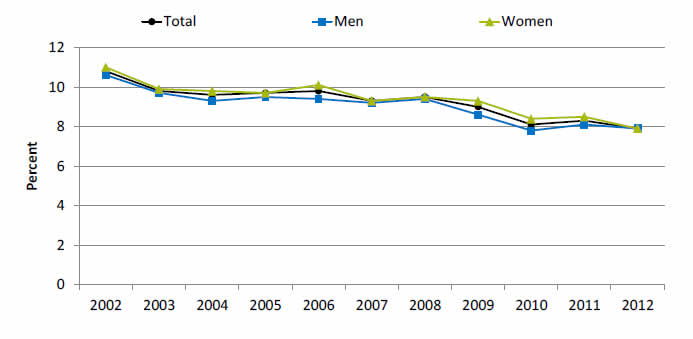
Adults who had a doctor's office or clinic visit in the last 12 months who had poor communication with their health providers, by sex, 2002-2012

| Sex | 2002 | 2003 | 2004 | 2005 | 2006 | 2007 | 2008 | 2009 | 2010 | 2011 | 2012 |
|---|---|---|---|---|---|---|---|---|---|---|---|
| Total | 10.8 | 9.8 | 9.6 | 9.7 | 9.8 | 9.3 | 9.5 | 9 | 8.1 | 8.3 | 7.9 |
| Men | 10.6 | 9.7 | 9.3 | 9.5 | 9.4 | 9.2 | 9.4 | 8.6 | 7.8 | 8.1 | 7.9 |
| Women | 11 | 9.9 | 9.8 | 9.7 | 10.1 | 9.3 | 9.5 | 9.3 | 8.4 | 8.5 | 7.9 |
Source: Agency for Healthcare Research and Quality, Medical Expenditure Panel Survey, 2002-2012.
Note: Poor communication refers to health providers who sometimes or never listened carefully, explained things clearly, respected what the patients had to say, and spent enough time with them, For this measure, lower rates are better.
- Importance: Patient-centered care is supported by good provider-patient communication so that patients’ needs and wants are understood and addressed and patients understand and participate in their own care (Hurtado, et al., 2001; Anderson, 2002). This style of care has been shown to improve patients’ health and health care (Heidenreich, 2013) and is reflected in this composite measure. Unfortunately, there are barriers to good communication: more than one-third of adults in the United States have low health literacy (Kountz, 2009), which means they lack the "capacity to obtain, process, and understand basic health information and services needed to make appropriate health decisions" (Selden, et al., 2000). Low health literacy is associated with higher mortality, higher rates of hospitalization, and poor self-management skills for chronic disease (Mitchell, et al., 2012).
- Trends: From 2002 to 2011, the percentage of adults who had poor communication with their health providers was slightly higher for women than for men, but in 2012 the percentages for men and women were the same.
Poor Communication With Health Providers
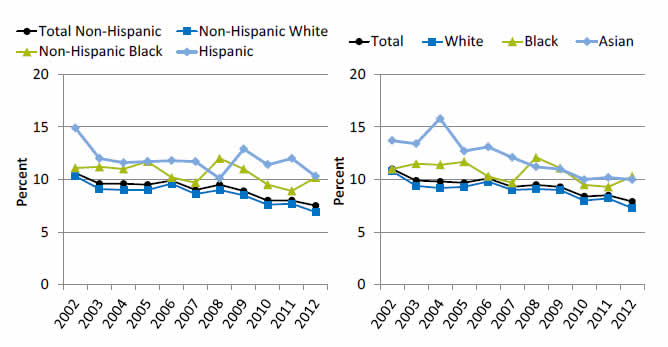
Adult women who had a doctor's office or clinic visit in the last 12 months who had poor communication with their health providers, by ethnicity and race, United States, 2002-2012

Left Graph:
| Year | Hispanic | Non-Hispanic Black | Non-Hispanic White | Total Non-Hispanic |
|---|---|---|---|---|
| 2002 | 14.9 | 11.1 | 10.3 | 10.6 |
| 2003 | 12 | 11.2 | 9.1 | 9.6 |
| 2004 | 11.6 | 11 | 9 | 9.6 |
| 2005 | 11.7 | 11.7 | 9 | 9.5 |
| 2006 | 11.8 | 10.2 | 9.6 | 9.9 |
| 2007 | 11.7 | 9.7 | 8.6 | 9 |
| 2008 | 10.1 | 12 | 9 | 9.5 |
| 2009 | 12.9 | 11 | 8.5 | 8.9 |
| 2010 | 11.4 | 9.5 | 7.6 | 8 |
| 2011 | 12 | 8.9 | 7.7 | 8 |
| 2012 | 10.3 | 10.2 | 6.9 | 7.5 |
Right Graph:
| Year | Total | Asian | Black | White |
|---|---|---|---|---|
| 2002 | 11 | 13.7 | 11 | 10.8 |
| 2003 | 9.9 | 13.4 | 11.5 | 9.4 |
| 2004 | 9.8 | 15.8 | 11.4 | 9.2 |
| 2005 | 9.7 | 12.7 | 11.7 | 9.3 |
| 2006 | 10.1 | 13.1 | 10.3 | 9.8 |
| 2007 | 9.3 | 12.1 | 9.7 | 9 |
| 2008 | 9.5 | 11.2 | 12.1 | 9.1 |
| 2009 | 9.3 | 11 | 11.1 | 9 |
| 2010 | 8.4 | 10 | 9.5 | 8 |
| 2011 | 8.5 | 10.2 | 9.3 | 8.2 |
| 2012 | 7.9 | 10 | 10.3 | 7.3 |
Source: Agency for Healthcare Research and Quality, Medical Expenditure Panel Survey, 2002-2012.
Note: Poor communication refers to health providers who sometimes or never listened carefully, explained things clearly, respected what they patients had to say, and spent enough time with them. For this measure, lower rates are better.
- Trends:
- From 2002 to 2012, the percentage of women reporting poor communication with their health providers was lower for non-Hispanic White women than for Hispanics and non-Hispanic Blacks.
- From 2002 to 2012, the percentage of White women who reported poor communication with their health providers decreased significantly from 10.3% to 6.9%.
- Groups With Disparities:
- In all years, Hispanic women were significantly more likely than non-Hispanic Blacks and Whites to report poor communication.
- In 10 of 11 years, non-Hispanic Black women were more likely than non-Hispanic White women to report poor communication with health providers.
Usual Source of Care Who Offered Language Assistance
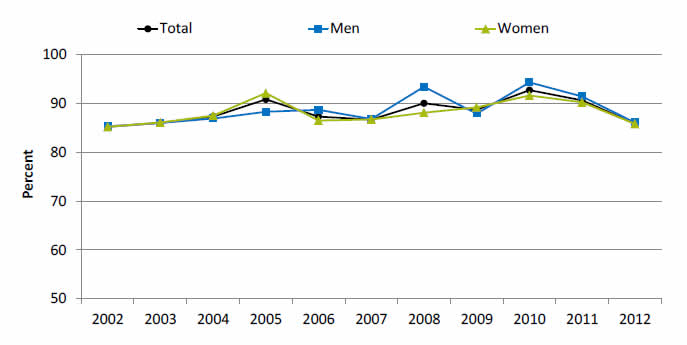
Adults with limited English proficiency and a usual source of care who offered language assistance, 2002-2012

| Year | Total | Men | Women |
|---|---|---|---|
| 2002 | 85.2 | 85.3 | 85.2 |
| 2003 | 86 | 86 | 86.1 |
| 2004 | 87.3 | 86.9 | 87.5 |
| 2005 | 90.8 | 88.3 | 92.1 |
| 2006 | 87.3 | 88.7 | 86.5 |
| 2007 | 86.7 | 86.8 | 86.7 |
| 2008 | 90 | 93.4 | 88.1 |
| 2009 | 88.7 | 87.9 | 89.2 |
| 2010 | 92.7 | 94.3 | 91.6 |
| 2011 | 90.6 | 91.4 | 90.2 |
| 2012 | 85.9 | 86.1 | 85.8 |
Source: Agency for Healthcare Research and Quality, Medical Expenditure Panel Survey, 2002-2012.
- Importance:
- Language barriers in health care are associated with decreases in quality of care, safety, and patient and clinician satisfaction and contribute to health disparities, even among people with insurance.
- The Federal Government has issued 14 culturally and linguistically appropriate services standards (https://thinkculturalhealth.hhs.gov/clas). These standards, which are directed at health care organizations, are also encouraged for individual providers to improve accessibility of their practices.
- Overall Rate: In 2012, the overall percentage of adults with limited English proficiency and a usual source of care (USC) who offered language assistance was 85.9%.


