National Healthcare Quality and Disparities Report
Measures of Effective Treatment of Cardiovascular Disease
- Treatment of Hypertension:
- Outcome: Adults with hypertension whose blood pressure is under control.
- Outcome: Children with high total cholesterol.
- Treatment of Heart Attack:
- Process: Hospital patients with heart attack given fibrinolytic medication within 30 minutes of arrival.
- Outcome: Inpatient deaths per 1,000 adult hospital admissions with heart attack.
- Treatment of Congestive Heart Failure:
- Outcome: Adult admissions for congestive heart failure per 100,000 population.
Measures of screening for cardiovascular disease and risk factors are in the Healthy Living chartbook.
Cardiovascular Disease Measures for Which Disparities Were Eliminated
- Inpatient deaths per 1,000 adult hospital admissions for heart attack:
- Medicare vs. any private insurance.
Treatment of Hypertension
Adults With Hypertension Whose Blood Pressure Is Under Control
Adults with hypertension whose blood pressure is under control, by age and education, 1999-2002, 2003-2006, 2007-2010, and 2011-2012
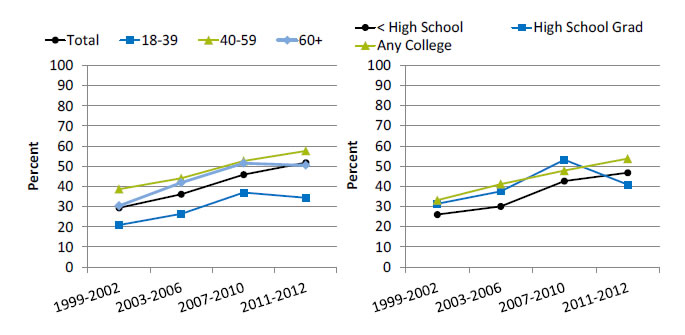
Left Chart:
| Age | 1999-2002 | 2003-2006 | 2007-2010 | 2011-2012 |
|---|---|---|---|---|
| Total | 29.4 | 36.2 | 45.9 | 51.8 |
| 18-39 | 20.9 | 26.4 | 37.0 | 34.4 |
| 40-59 | 38.7 | 44.1 | 52.7 | 57.7 |
| 60+ | 30.4 | 41.9 | 51.6 | 50.5 |
Right Chart:
| Education | 1999-2002 | 2003-2006 | 2007-2010 | 2001-2012 |
|---|---|---|---|---|
| < High School | 26.0 | 30.0 | 42.6 | 46.7 |
| High School Grad | 31.4 | 37.5 | 53.2 | 40.8 |
| Any College | 33.1 | 41.1 | 47.8 | 53.7 |
Source: Centers for Disease Control and Prevention, National Center for Health Statistics, National Health and Nutrition Examination Survey, 1999-2002, 2003-2006, 2007-2010, and 2011-2012.
Denominator: U.S. civilian noninstitutionalized population age 18 and over.
Note: Rates are age adjusted to the 2000 U.S. standard population. Blood pressure under control is defined as having a mean systolic blood pressure <140 and mean diastolic blood pressure <90 among all hypertensive patients.
- Importance: Although progress has been made in raising awareness of blood pressure screening and monitoring, blood pressure control among people with diagnosed high blood pressure remains a problem.
- Trends: From 1999-2002 to 2011-2012, the percentage of adults with hypertension who had their blood pressure under control improved overall. The percentage also improved for adults with less than a high school education and adults with any college. There was no statistically significant change among high school graduates.
- Groups With Disparities: In all years, adults with hypertension ages 40-59 and 60 years and over were more likely than adults ages 18-39 with hypertension to have their blood pressure under control.
Children and Adolescents With High Cholesterol
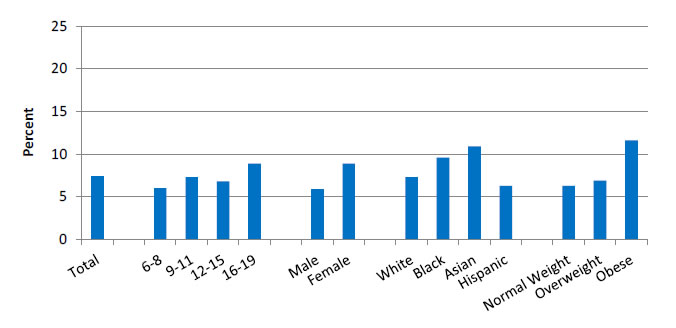
Percentage of children and adolescents ages 6-19 with high total cholesterol, by age, sex, race/ethnicity, and body weight, 2011-2014 combined
Source: Centers for Disease Control and Prevention, National Center for Health Statistics, National Health and Nutrition Examination Survey, 2011-2014.
Note: For this measure, lower rates are better. White, Black, and Asian are non-Hispanic. Hispanic includes all races.
- Importance: Serum lipid concentrations track from childhood into adulthood (Chauhan & Paunikar, 2014). Among adults in the United States, dyslipidemia is associated with cardiovascular events, including premature death (Kit BK, et al, 2015). Early identification of dyslipidemia may improve long-term health outcomes. Current evidence-based clinical practice guidelines recommend universal screening of serum lipid concentrations during childhood (Chauhan & Paunikar, 2014).
- Overall Rate: During 2011-2014, overall, 7.4% of children and adolescents ages 6-19 had high total cholesterol.
- Groups With Disparities:
- The percentage of children and adolescents with high cholesterol was lower among children ages 6-8 (6.0%) than adolescents ages 16-19 (8.9%).
- A higher percentage of females (8.9%) had high total cholesterol compared with males (5.9%).
- A higher percentage of Black (9.6%) and Asian (10.9%) children and adolescents had high total cholesterol compared with White (7.3%) children and adolescents.
- The percentage of obese children and adolescents who had high total cholesterol was nearly twice the percentage of normal weight children with high total cholesterol (11.6% compared with 6.3%).
Children and Adolescents With Poor Cholesterol Levels
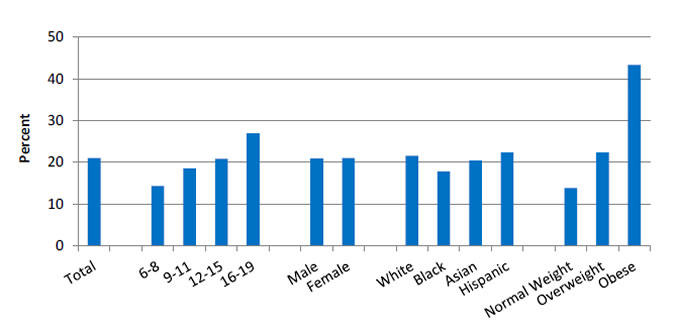
Percentage of children and adolescents ages 6-19 with high total cholesterol, low high-density lipoprotein cholesterol, or high non-high-density lipoprotein cholesterol, by age, race/ethnicity, and body mass index, 2011-2014 combined
Source: Centers for Disease Control and Prevention, National Center for Health Statistics, National Health and Nutrition Examination Survey, 2011-2014.
Note: For this measure, lower rates are better. White, Black, and Asian are non-Hispanic. Hispanic includes all races.
- Importance: Studies have shown that atherosclerosis begins in childhood and can lead to coronary heart disease in adults. It has also been shown that there is a strong correlation between pediatric hyperlipidemia, carotid intimal thickening, and cardiovascular events in adults (Chauhan & Paunikar, 2014). The Bogalusa Heart Study demonstrated that non-high-density lipoprotein cholesterol is a better predictor of adult dyslipidemia than low-density lipoprotein cholesterol (Srinivasan, et al., 2006).
- Overall Rate: During 2011-2014, overall, 21.0% of children and adolescents had an abnormal cholesterol measure.
- Groups With Disparities:
- The percentage of children and adolescents who had at least one abnormal cholesterol reading increased with age. Approximately 14% of children ages 6-8 had at least one abnormal cholesterol reading and 26.9% of adolescents ages 16-19 had at least one abnormal cholesterol measure.
- The percentage of Black children and adolescents with at least one abnormal cholesterol reading was lower than the percentage of White children and adolescents with at least one abnormal cholesterol reading (17.8% compared with 21.5%).
- The percentage of obese children with at least one abnormal cholesterol measure (43.3%) was more than three times as high as the percentage among children of normal weight (13.8%).
Treatment of Heart Attack
Timely Receipt of Fibrinolytic Medication
Hospital patients with heart attack given fibrinolytic medication within 30 minutes of arrival, by sex and race/ethnicity, 2005-2013
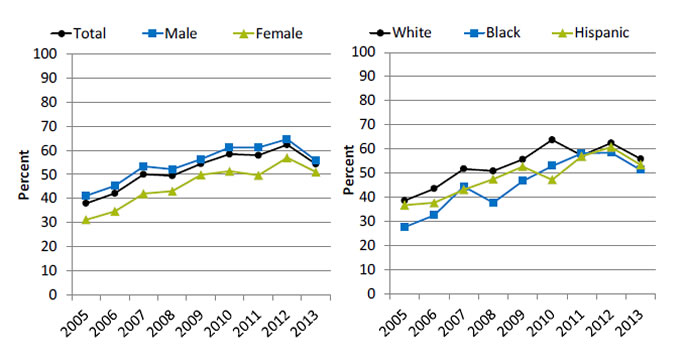
Left Chart:
| Sex | 2005 | 2006 | 2007 | 2008 | 2009 | 2010 | 2011 | 2012 | 2013 |
|---|---|---|---|---|---|---|---|---|---|
| Total | 37.9 | 42.1 | 50 | 49.4 | 54.4 | 58.4 | 57.9 | 62.3 | 54.3 |
| Female | 31.1 | 34.6 | 42 | 43.0 | 49.8 | 51.3 | 49.6 | 56.9 | 51 |
| Male | 41.1 | 45.2 | 53.3 | 52.1 | 56.3 | 61.2 | 61.1 | 64.6 | 55.8 |
Right Chart:
| Race/Ethnicity | 2005 | 2006 | 2007 | 2008 | 2009 | 2010 | 2011 | 2012 | 2013 |
|---|---|---|---|---|---|---|---|---|---|
| White | 38.7 | 43.6 | 51.8 | 51.0 | 55.7 | 63.8 | 57.3 | 62.5 | 55.9 |
| Black | 27.7 | 32.6 | 44.5 | 37.8 | 46.8 | 53 | 58.2 | 58.5 | 51.4 |
| Hispanic | 36.8 | 37.8 | 43.2 | 47.6 | 52.8 | 47.3 | 57 | 60.8 | 53.5 |
Source: Centers for Medicare & Medicaid Services, Medicare Quality Improvement Organization Program, 2005-2013.
Denominator: Discharged hospital patients with a principal diagnosis of acute myocardial infarction and documented receipt of thrombolytic therapy during the hospital stay.
- Importance: Some heart attacks are caused by blood clots. Early actions, such as fibrinolytic medication, may open blockages caused by blood clots, reduce heart muscle damage, and save lives. To be effective, these actions need to be performed quickly after the start of a heart attack.
- Trends: From 2005 to 2013, the percentage of patients who received timely fibrinolytic medication improved overall, for both sexes, and for all racial/ethnic groups.
- Groups With Disparities:
- In 7 of 9 years, the percentage of patients who received timely fibrinolytic medication was significantly higher for males than for females. In the 2 most recent years, there was no statistically significant difference in the percentage of male and female patients who received timely fibrinolytic medication.
- From 2005 to 2010, the percentage of patients who received timely fibrinolytic medication was significantly higher for Whites than for Blacks. From 2011 to 2013, there was no statistically significant difference in the percentage of White and Black patients who received timely fibrinolytic medication.
Inpatient Deaths From Heart Attack, by Payment Source
Inpatient deaths per 1,000 adult hospital admissions for heart attack, by expected payment source, 2000-2013
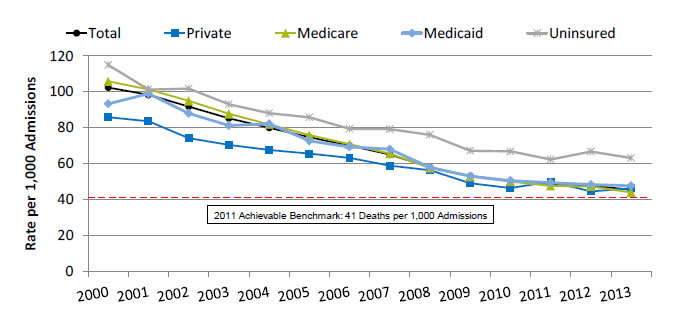
| Payment Source | 2000 | 2001 | 2002 | 2003 | 2004 | 2005 | 2006 | 2007 | 2008 | 2009 | 2010 | 2011 | 2012 | 2013 |
|---|---|---|---|---|---|---|---|---|---|---|---|---|---|---|
| Total | 102.4 | 98.3 | 91.8 | 85.2 | 79.9 | 74.7 | 69.9 | 65.0 | 57.9 | 53.0 | 50.2 | 48.7 | 47.6 | 45.4 |
| Private | 85.9 | 83.6 | 74.2 | 70.4 | 67.6 | 65.5 | 63.1 | 58.8 | 56.3 | 49.0 | 46.3 | 49.9 | 44.5 | 46.2 |
| Medicaid | 93.2 | 98.9 | 87.9 | 81.2 | 82.1 | 72.6 | 69.2 | 68.0 | 57.8 | 53.0 | 50.4 | 49.3 | 48.3 | 47.7 |
| Medicare | 105.8 | 101.2 | 94.9 | 87.6 | 81.8 | 75.8 | 70.7 | 65.5 | 57.5 | 52.7 | 50.0 | 47.5 | 47.2 | 43.9 |
| Uninsured | 114.9 | 101.3 | 101.7 | 93.1 | 88.0 | 85.7 | 79.3 | 79.2 | 76.0 | 67.1 | 66.7 | 62.3 | 66.7 | 63.1 |
2011 Achievable Benchmark: 41 Deaths per 1,000 Admissions.
Source: Agency for Healthcare Research and Quality, Healthcare Cost and Utilization Project, Nationwide (2000-2011) and National (2012-2013) Inpatient Samples and AHRQ Quality Indicators, version 4.4.
Denominator: Adults age 18 and over admitted to a non-Federal community hospital in the United States with acute myocardial infarction as principal discharge diagnosis.
Note: For this measure, lower rates are better. Rates are adjusted by age, major diagnostic category, all payer refined-diagnosis related group risk of mortality score, and transfers into the hospital.
- Importance: Heart attack is a common life-threatening condition that requires rapid recognition and efficient treatment in a hospital to reduce the risk of serious heart damage and death.
- Trends: From 2000 to 2013, the risk-adjusted inpatient mortality rate for hospital admissions with heart attack decreased significantly overall and for all insurance groups.
- Groups With Disparities: In all years, uninsured patients had higher inpatient mortality rates for hospital admissions with heart attack than privately insured patients.
- Achievable Benchmark:
- The 2011 top 4 State achievable benchmark for inpatient heart attack mortality was 41 deaths per 1,000 admissions. The top 4 States that contributed to the achievable benchmark are Arizona, Georgia, Michigan, and Ohio.
- At the current rate of improvement, the 2011 benchmark could be met for the total population in approximately 1 year.
- At current rates of improvement, uninsured patients could reach the 2011 benchmark in 6 years while other insurance groups could reach it in less than 2 years.
Inpatient Deaths From Heart Attack, by Residence Location
Inpatient deaths per 1,000 adult hospital admissions for heart attack, by residence location, 2000-2013
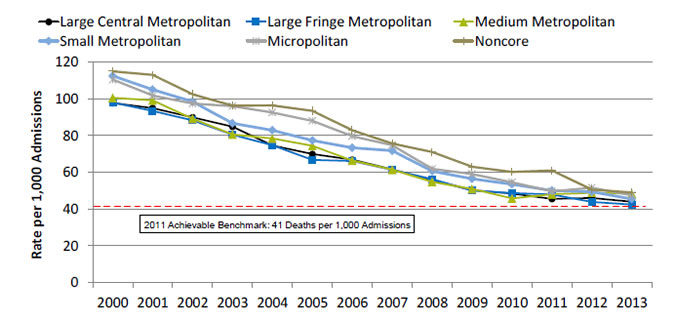
| Residence Location | 2000 | 2001 | 2002 | 2003 | 2004 | 2005 | 2006 | 2007 | 2008 | 2009 | 2010 | 2011 | 2012 | 2013 |
|---|---|---|---|---|---|---|---|---|---|---|---|---|---|---|
| Large Central Metropolitan | 97.6 | 94.9 | 89.8 | 84.7 | 74.5 | 69.9 | 66.8 | 61.4 | 55.7 | 50.2 | 48.5 | 45.5 | 46.0 | 43.9 |
| Large Fringe Metropolitan | 97.9 | 93.4 | 88.2 | 80.4 | 74.7 | 66.8 | 66.0 | 61.2 | 56.2 | 50.1 | 48.6 | 47.9 | 43.8 | 42.4 |
| Medium Metropolitan | 100.4 | 99.1 | 89.1 | 80.5 | 78.3 | 74.4 | 66.3 | 61.3 | 54.7 | 51.0 | 45.7 | 48.0 | 48.8 | 48.3 |
| Small Metropolitan | 112.4 | 104.9 | 98.4 | 86.6 | 82.7 | 77.3 | 73.3 | 71.7 | 60.5 | 56.4 | 53.5 | 50.0 | 49.4 | 45.4 |
| Micropolitan | 110.3 | 101.7 | 97.3 | 96.0 | 92.5 | 87.9 | 79.6 | 74.8 | 61.7 | 59.0 | 54.5 | 49.6 | 51.6 | 47.5 |
| Noncore | 114.9 | 112.9 | 102.3 | 96.3 | 96.3 | 93.4 | 82.8 | 75.6 | 71.0 | 62.9 | 60.1 | 60.9 | 50.5 | 49.0 |
2011 Achievable Benchmark: 41 Deaths per 1,000 Admissions.
Source: Agency for Healthcare Research and Quality, Healthcare Cost and Utilization Project, Nationwide (2000-2011) and National (2012-2013) Inpatient Sample and AHRQ Quality Indicators, version 4.4.
Denominator: Adults age 18 and over admitted to a non-Federal community hospital in the United States with acute myocardial infarction as principal discharge diagnosis.
Note: For this measure, lower rates are better. Rates are adjusted by age, major diagnostic category, all payer refined-diagnosis related group risk of mortality score, and transfers into the hospital.
- Importance: Urban-rural disparities in cardiovascular mortality have been observed.
- Trends: From 2000 to 2013, the risk-adjusted inpatient mortality rate for hospital admissions with heart attack decreased significantly for all residence location groups.
- Groups With Disparities: In all years, residents of micropolitan and noncore areas had higher inpatient mortality rates for hospital admissions with heart attack than residents of large fringe metropolitan areas.
- Achievable Benchmark:
- The 2011 top 4 State achievable benchmark for inpatient heart attack mortality was 41 deaths per 1,000 admissions. The top 4 States that contributed to the achievable benchmark are Arizona, Georgia, Michigan, and Ohio.
- At current rates of improvement, patients from large fringe, large central, and small metropolitan areas could reach the 2011 benchmark in less than a year while patients from micropolitan, noncore, and medium metropolitan areas could reach the benchmark in a year and a half.
Inpatient Deaths From Heart Attack, by Race/Ethnicity
Inpatient deaths per 1,000 adult hospital admissions for heart attack, by race/ethnicity, 2001-2013
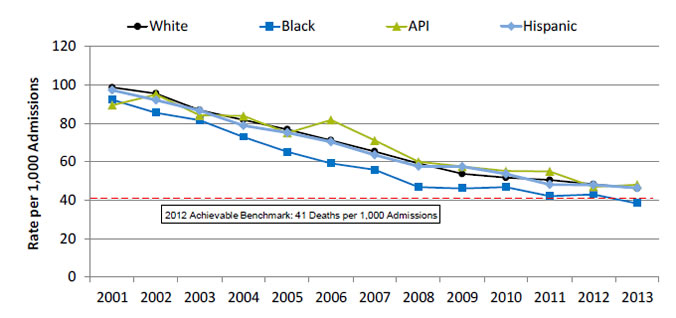
| Year | White | Black | API | Hispanic |
|---|---|---|---|---|
| 2001 | 98.7 | 92.2 | 89.5 | 97.2 |
| 2002 | 95.5 | 85.5 | 95.0 | 92.0 |
| 2003 | 86.9 | 81.6 | 84.2 | 86.6 |
| 2004 | 81.8 | 72.9 | 83.9 | 78.8 |
| 2005 | 76.9 | 65.2 | 75.0 | 75.2 |
| 2006 | 71.2 | 59.2 | 81.8 | 70.4 |
| 2007 | 65.4 | 55.8 | 71.1 | 63.6 |
| 2008 | 59.1 | 46.8 | 60.0 | 57.6 |
| 2009 | 53.7 | 46.1 | 57.5 | 57.5 |
| 2010 | 51.7 | 46.7 | 55.2 | 53.6 |
| 2011 | 50.5 | 42.1 | 55.0 | 48.1 |
| 2012 | 48.3 | 43.0 | 47.0 | 48.0 |
| 2013 | 46.1 | 38.3 | 48.1 | 46.4 |
2012 Achievable Benchmark: 41 Deaths per 1,000 Admissions.
Key: API = Asian or Pacific Islander.
Source: Agency for Healthcare Research and Quality, Healthcare Cost and Utilization Project, State Inpatient Databases, disparities analysis files and AHRQ Quality Indicators, version 4.4, 2001-2013.
Denominator: Adults age 18 and over admitted to a non-Federal community hospital in the United States with acute myocardial infarction as principal discharge diagnosis.
Note: For this measure, lower rates are better. Rates are adjusted by age, major diagnostic category, all payer refined-diagnosis related group risk of mortality score, and transfers into the hospital. White and Black are non-Hispanic. Hispanic includes all races.
- Importance: Racial disparities in heart attack care have been observed.
- Trends: From 2001 to 2013, the risk-adjusted inpatient mortality rate for hospital admissions with heart attack decreased significantly for all racial/ethnic groups.
- Groups With Disparities: In 10 of 13 years, Black patients had lower inpatient mortality rates for hospital admissions with heart attack than White patients.
- Achievable Benchmark:
- The 2011 top 4 State achievable benchmark for inpatient heart attack mortality was 41 deaths per 1,000 admissions. The top 4 States that contributed to the achievable benchmark are Arizona, Georgia, Michigan, and Ohio.
- In 2013, Blacks had achieved the benchmark.
- At current rates of improvement, all other racial/ethnic groups could reach the benchmark in less than 2 years.
Treatment of Heart Failure
Admissions With Congestive Heart Failure, by Area Income
Adult admissions with congestive heart failure per 100,000 population, by area income, 2000-2013
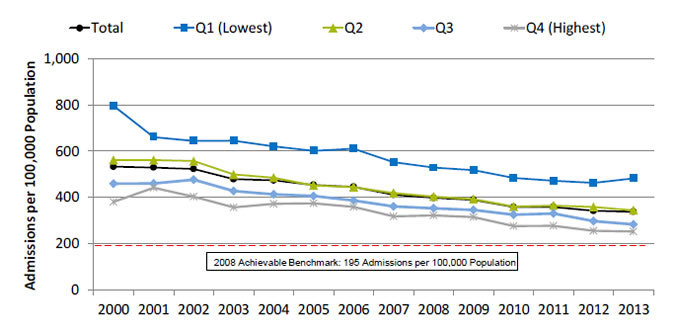
| Year | Total | Q1 (Lowest) |
Q2 | Q3 | Q4 (Highest) |
|---|---|---|---|---|---|
| 2000 | 532.4 | 796.1 | 561.6 | 458.0 | 379.5 |
| 2001 | 528.6 | 660.8 | 561.8 | 459.4 | 441.3 |
| 2002 | 522.7 | 643.9 | 556.9 | 476.1 | 402.2 |
| 2003 | 478.1 | 645.7 | 498.7 | 426.3 | 356.4 |
| 2004 | 472.8 | 620.9 | 484.5 | 412.5 | 370.9 |
| 2005 | 453.0 | 601.4 | 450.8 | 405.1 | 373.8 |
| 2006 | 444.6 | 610.2 | 443.9 | 385.2 | 357.6 |
| 2007 | 410.7 | 551.6 | 418.0 | 360.5 | 316.6 |
| 2008 | 397.3 | 528.5 | 402.9 | 352.0 | 320.7 |
| 2009 | 388.5 | 517.6 | 391.5 | 345.2 | 314.0 |
| 2010 | 357.2 | 483.7 | 359.3 | 324.5 | 275.3 |
| 2011 | 357.6 | 471.3 | 364.1 | 329.0 | 276.5 |
| 2012 | 341.0 | 462.0 | 357.6 | 296.5 | 254.9 |
| 2013 | 337.1 | 481.6 | 343.3 | 282.1 | 252.0 |
2008 Achievable Benchmark: 195 Admissions per 100,000 Population.
Key: Q = quartile.
Source: Agency for Healthcare Research and Quality, Healthcare Cost and Utilization Project, Nationwide (2000-2011) and National (2012-2013) Inpatient Sample and AHRQ Quality Indicators, version 4.4.
Denominator: U.S. resident population age 18 and over.
Note: For this measure, lower rates are better. Area income is based on the median income of a patient’s ZIP Code of residence.
- Importance: Some hospitalizations for heart failure are unavoidable, but rates of hospitalization can be influenced by the quality of outpatient care.
- Trends: From 2000 to 2013, the rate of admission for congestive heart failure among adults decreased significantly overall and for all area income groups.
- Groups With Disparities: In all years, rates of admission for congestive heart failure were higher among residents in the lowest and second area income quartiles compared with residents in the highest area income quartile.
- Achievable Benchmark:
- The 2008 top 4 State achievable benchmark for adult congestive heart failure admissions was 195 admissions per 100,000 population. The top 4 States that contributed to the achievable benchmark are Colorado, Oregon, Utah, and Vermont.
- At current rates of improvement, residents in the highest area income quartile could achieve the benchmark in 4 years while residents in the lowest area income quartile would need 15 years.
Admissions With Congestive Heart Failure, by Race/Ethnicity
Adult admissions with congestive heart failure per 100,000 population, by race/ethnicity, 2001-2013
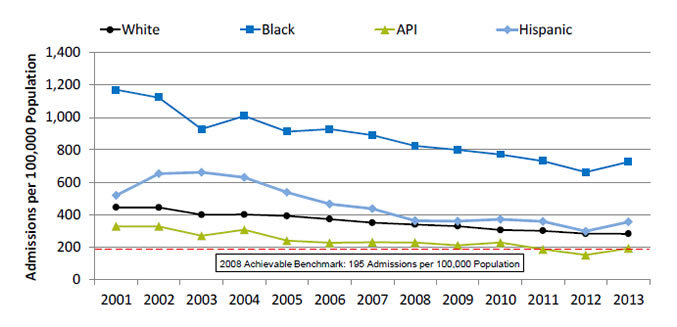
| Year | White | Black | API | Hispanic |
|---|---|---|---|---|
| 2001 | 445.4 | 1169.8 | 328.0 | 519.5 |
| 2002 | 444.1 | 1121.8 | 328.4 | 653.0 |
| 2003 | 399.5 | 927.8 | 269.9 | 662.2 |
| 2004 | 400.9 | 1009.3 | 307.6 | 629.9 |
| 2005 | 392.8 | 912.4 | 239.4 | 538.0 |
| 2006 | 373.0 | 927.5 | 226.7 | 465.9 |
| 2007 | 350.8 | 890.2 | 230.0 | 437.1 |
| 2008 | 339.9 | 824.6 | 228.1 | 362.8 |
| 2009 | 329.7 | 799.2 | 211.0 | 360.2 |
| 2010 | 306.3 | 771.4 | 227.8 | 372.7 |
| 2011 | 301.1 | 730.5 | 186.5 | 359.2 |
| 2012 | 283.2 | 662.2 | 152.0 | 298.9 |
| 2013 | 282.5 | 726.1 | 192.8 | 356.7 |
2008 Achievable Benchmark: 195 Admissions per 100,000 Population.
Key: API = Asian or Pacific Islander.
Source: Agency for Healthcare Research and Quality, Healthcare Cost and Utilization Project, State Inpatient Databases, disparities analysis files and AHRQ Quality Indicators, version 4.4, 2001-2013.
Denominator: U.S. resident population age 18 and over.
Note: For this measure, lower rates are better. White and Black are non-Hispanic. Hispanic includes all races.
- Importance: Racial disparities in care for congestive heart failure have been observed.
- Trends: From 2001 to 2013, the rate of admission for congestive heart failure among adults decreased significantly for all racial/ethnic groups.
- Groups With Disparities: In all years, rates of admission for congestive heart failure were higher among Blacks and lower among Asians and Pacific Islanders (API) compared with Whites.
- Achievable Benchmark:
- The 2008 top 4 State achievable benchmark for adult congestive heart failure admissions was 195 admissions per 100,000 population. The top 4 States that contributed to the achievable benchmark are Colorado, Oregon, Utah, Vermont.
- At current rates of improvement, the benchmark could be achieved by Hispanics in 5 years and Whites could achieve it in 6 years. Blacks would need 15 years to achieve the benchmark.
- APIs have already achieved the benchmark.
References
Chauhan A, Paunikar P. Update on pediatric hyperlipidemia. Curr Opin Pediatr 2014 Apr;26(2):252-8. PMID: 24553633.
Kit BK, Kuklina E, Carroll MD, Ostchega Y, Freedman DS, Ogden CL. Prevalence of and trends in dyslipedmia and blood pressure among children and adolescents, 1999-2012. JAMA Pediatr 2015;169(3):272-279
Srinivasan SR, Frontini MG, Xu J, et al. Utility of childhood non-high-density lipoprotein cholesterol levels in predicting adult dyslipidemia and other cardiovascular risks: the Bogalusa Heart Study. Pediatrics 2006 Jul;118(1):201-6. http://pediatrics.aappublications.org/content/118/1/201.long?sso=1&sso_redirect_count=1&nfstatus=401&nftoken=00000000-0000-0000-0000-000000000000&nfstatusdescription=ERROR%3a+No+local+token. Accessed August 29, 2016.


