National Healthcare Quality and Disparities Report
Overview
- HIV is a virus that kills or damages cells of the body’s immune system.
- AIDS is the most advanced stage of HIV infection.
- HIV can be spread through:
- Any unprotected sex with an infected person.
- Sharing of drug needles with an infected person.
- Contact with the blood of an infected person.
- Women can pass the virus to their babies during pregnancy, childbirth, or breastfeeding.
- Select for more information.
Impact of HIV and AIDS
- The impact of HIV and AIDS is disproportionately higher for:
- Racial and ethnic minorities.
- People of lower income or education levels.
- Other vulnerable populations with high-risk behaviors, such as, men who have sex with men (MSM) and transgender people.
Access to Care for HIV and AIDS
- Although access to care has improved, several groups of people living with HIV remain less likely to have access to care and less likely to have optimal patterns of care:
- Blacks and Hispanics.
- Women.
- Injection drug users.
- Homeless people.
- Uninsured people (Colasanti, et al., 2016; Horberg, 2015; Moore, 2011).
Prevalence and Incidence of HIV Infection
- The Centers for Disease Control and Prevention estimates that:
- More than 1.2 million people age 13 years and over are living with HIV.
- About 13.0% of people living with HIV are unaware of their infection.
- From 2005 to 2014, the annual number of new HIV diagnoses declined by 19%, however the progress is uneven across different groups.
- The rate of new infections is high among certain groups, such as MSM and transgender people.
- Select for more information.
Diagnoses of HIV Infection by Race/Ethnicity
- In 2014, the estimated total number of diagnoses of HIV infection in the United States was 44,073 (CDC, 2016a), with a rate of 13.8 per 100,000 population (CDC, 2015c).
- The estimated 2014 rate of diagnosis of HIV infection per 100,000 population follows (CDC, 2015c):
- Whites, 6.1.
- Blacks, 49.4.
- Hispanics/Latinos, 18.4.
- Multiple-race individuals, 15.4.
- Native Hawaiians and Other Pacific Islanders (NHOPIs), 10.6.
- American Indians and Alaska Natives (AI/ANs), 9.5.
- Asians, 6.2.
Diagnoses of HIV Infection Among Adult and Adolescent Males, by Race/Ethnicity, 2014
- The estimated 2014 rate of diagnosis of HIV infection per 100,000 population of adult and adolescent males follows (CDC, 2016b):
- Whites, 12.6.
- Blacks, 94.0.
- Hispanics, 41.5.
- Multiple-race individuals, 40.6.
- NHOPIs, 22.0.
- AI/ANs, 18.3.
- Asians, 13.4.
Diagnoses of HIV Infection Among Adult and Adolescent Females, by Race/Ethnicity, 2014
- The estimated 2014 rate of diagnosis of HIV infection per 100,000 population of adult and adolescent females follows (CDC, 2016b):
- Whites, 1.7.
- Blacks, 30.
- Hispanics, 6.5.
- Multiple-race individuals, 8.2.
- NHOPIs, 3.5.
- AI/ANs, 5.1.
- Asians, 1.8.
Diagnoses of HIV Infection by Transmission Category
- In 2014, estimated HIV diagnoses among male and female adults and adolescents in the United States (43,898) were attributed to the following (CDC, 2015c):
- Male-to-male sexual contact, 67% (29,418).
- Heterosexual contact (males), 7.5% (3,285).
- Heterosexual contact (females), 16.5% (7,242).
- Injection drug use (males), 3.6% (1,590).
- Injection drug use (females), 2.4% (1,045).
- Male-to-male sexual contact and injection drug use, 2.8% (1,217).
- Other transmissions, <1% (101).
- The estimated HIV diagnoses among male and female adults and adolescents excludes children under age 13.
HIV and AIDS Among MSM
- In 2014, in the United States, male-to-male sexual contact accounted for:
- 83% (29,418) of the 35,571 estimated HIV diagnoses among all males age 13 years and over (CDC, 2015a).
- 58% (12,059) of the 20,792 estimated AIDS diagnoses among adults and adolescents (CDC, 2015c).
- Gay, bisexual, and other men who have sex with men represent only 2% of the U.S. population but account for 55% of people living with HIV in the United States:
- From 2005 to 2014, HIV diagnoses decreased in the United States by 19% overall but increased by 6% among all gay and bisexual men, which was driven by increases among African American and Hispanic/Latino gay and bisexual men.
- In the same timeframe, increases in HIV diagnoses among all gay and bisexual men was less than 1%, although progress is different among racial/ethnic groups (CDC, 2015a).
Racial/Ethnic Makeup of MSM Diagnosed With AIDS
- The racial/ethnic makeup of the estimated 12,059 MSM diagnosed with AIDS in 2014 (CDC, 2015c) follows:
- Whites, 32.3% (3,899).
- Blacks, 37.9% (4,576).
- Hispanics, 23.3% (2,809).
- Multiple-race individuals, 3.8% (463).
- NHOPIs, <1% (14).
- AI/ANs, <1% (53).
- Asians, 2.0% (245).
HIV and AIDS Care Among MSM
- In 2014, in the United States, among MSM with diagnosed HIV infection, 84% were linked to care within 3 months of diagnosis (CDC, 2015a).
- According to the most recent data, among MSM who had been living with diagnosed HIV infection for at least a year:
- 57% were retained in care.
- 58% had achieved viral suppression (CDC, 2015a).
- Select for more information.
HIV/AIDS Among Transgender People
- The transgender population has been significantly affected by the HIV epidemic in the United States.
- Transgender women have the highest risk of HIV infection:
- HIV prevalence in transgender women is an estimated 21.7% (Baral, et al., 2013).
- Among male-to-female (MTF) transgender people, 28% tested positive for HIV infection, but 12% self-reported being HIV positive (CDC, 2015b), suggesting many are unaware of their serostatus.
- Higher HIV rates (56.3% for test results and 30.8% for self-reporting) were found among MTF Blacks (Herbst, et al., 2008).
- Black transgender women have the highest percentage of new HIV positive test results (Herbst, et al., 2008).
- Select for more information.
HIV and AIDS Prevention in Transgender Populations
- Transgender people often engage in behaviors that increase the risk of HIV infection, such as:
- Multiple sex partners or unprotected sex.
- Commercial sex work.
- Use of needle injections for recreational drugs or to alter gender (e.g., hormones, silicone) (Herbst, et al., 2008; Stephens, et al., 2011).
- Improved data collection on the transgender population is crucial:
- Due to limited data, it is difficult to create evidence-based HIV preventive interventions that meet the unique needs of transgender populations.
- Varying definitions of the transgender population further complicate data collection; for example, only 33% report having surgically transitioned (Grant, et al., 2011).
- Select for more information.
HIV and AIDS Among People Who Inject Drugs
- Injection drug use leads to approximately 10% of HIV cases in the United States annually (AIDS.gov).
- Injection drug users obtain and spread HIV by:
- Sharing drug preparation or injecting equipment with a person who has HIV.
- Engaging in risky sexual behaviors with their sex and drug-using partners.
- Select for more information.
HIV and AIDS Among People in Rural Communities Who Inject Drugs
- Overall, HIV transmission related to injection drug use has declined.
- Increasing trends of prescription opioid analgesics and hepatitis C infections are seen in rural communities.
- An estimated 50% of injection drug users in the United States reside outside major metropolitan areas, but only 5.8% of syringes are exchanged in rural areas.
- Resources are lacking for HIV prevention and treatment (Peters, et al., 2016).
HIV and AIDS and Hepatitis Among People Who Inject Drugs
- About 80% of HIV-infected injection drug users in the United States also have hepatitis C (HCV) (AIDS.gov):
- HCV leads to cirrhosis of the liver and liver cancer.
- HCV is more serious in people living with HIV because it leads to liver damage more quickly.
- Co-infection with HCV also affects treatment of HIV infection, such as slowing the rate of immune response to therapy.
- Select for more information.
HIV and AIDS Policy
- The White House Office of National AIDS Policy launched the National HIV/AIDS Strategy (NHAS) in July 2010.
- NHAS was updated to 2020:
- Goal 1: Reduce new HIV infections.
- Goal 2: Increase access to care and improve health outcomes for people living with HIV.
- Goal 3: Reduce HIV-related disparities and health inequalities.
- Goal 4: Achieve a more coordinated national response to the HIV epidemic.
- Select for more information (PDF File, 2.23 MB).
NHAS 2020: Federal Action Plan
- Widespread HIV testing and linkage to care:
- SAMHSA: Guide award recipients on HIV testing practices to focus on communities with greatest prevalence of HIV.
- Improved retention in care and viral suppression:
- HRSA: Use of data-driven strategies to promote quality improvement and integration of HIV care into primary care practices.
- Full access to comprehensive PrEP services:
- CDC: Rapid dissemination of lessons learned from demonstration projects and implementation research to increase awareness and uptake.
- Select for more information (PDF File, 580.92 KB).
HIV and AIDS Measures
- Outcome: New HIV cases.
- Process: Adult patients with HIV and at least two CD4 cell counts of 200 or less who received Pneumocystis pneumonia prophylaxis.
- Outcome: People living with HIV who know their serostatus.
- Process: People with an HIV diagnosis who had at least two CD4 or viral load tests performed at least 3 months apart during the last year.
- Outcome: People with an HIV diagnosis in medical care whose most recent viral load in the last 12 months was <200 copies/mL.
- Process: People with an HIV diagnosis in medical care who were prescribed antiretroviral therapy in the last 12 months.
- Outcome: HIV infection deaths.
- Ryan White HIV/AIDS Program:
- Outcome: HIV patients with at least one HIV care visit and most recent viral load <200 during the year.
- Process: HIV patients who were retained in HIV care (at least 2 ambulatory visit dates at least 90 days apart).
Measure Reintroduced in the QDR
- Eligible patients receiving Pneumocystis pneumonia prophylaxis: Reintroduced because performance fell below 95%.
- Measures that reach performance levels of 95% are no longer reported. Data on these measures will continue to be collected and these measures will be added back to the reports if their performance falls below 95%.
- Select for more information.
New HIV Cases
New HIV Cases per 100,000 Population
New HIV cases per 100,000 population age 13 and over, by race/ethnicity and sex, United States, 2008-2013
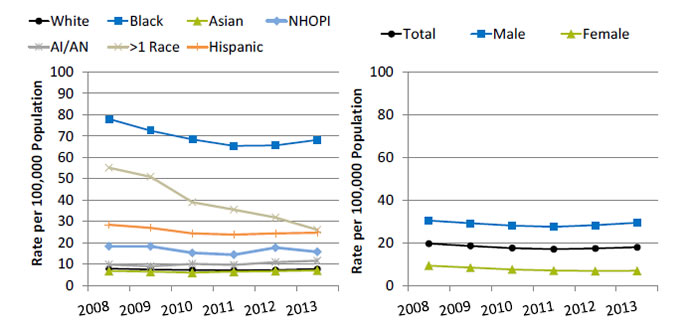
Left Chart:
| Race/Ethnicity | 2008 | 2009 | 2010 | 2011 | 2012 | 2013 |
|---|---|---|---|---|---|---|
| White | 7.9 | 7.5 | 7.2 | 7.0 | 7.2 | 7.7 |
| Black | 78.0 | 72.5 | 68.4 | 65.4 | 65.6 | 68.2 |
| Asian | 6.8 | 6.4 | 6.0 | 6.4 | 6.7 | 7.0 |
| AI/AN | 9.8 | 9.0 | 10.1 | 9.6 | 10.9 | 11.6 |
| NHOPI | 18.3 | 18.3 | 15.2 | 14.4 | 17.7 | 15.7 |
| Hispanic | 28.4 | 26.9 | 24.4 | 23.8 | 24.3 | 24.7 |
| >1 Race | 55.1 | 50.9 | 38.9 | 35.5 | 31.8 | 26.0 |
Right Chart:
| Sex | 2008 | 2009 | 2010 | 2011 | 2012 | 2013 |
|---|---|---|---|---|---|---|
| Total | 19.6 | 18.5 | 17.5 | 17.0 | 17.3 | 17.9 |
| Male | 30.4 | 29.1 | 28.0 | 27.4 | 28.2 | 29.4 |
| Female | 9.3 | 8.3 | 7.5 | 7.0 | 6.8 | 6.9 |
Key: AI/AN = American Indian and Alaska Native; NHOPI = Native Hawaiian or Other Pacific Islander.
Source: Centers for Disease Control and Prevention. CDC Fact Sheet: Estimates of new HIV infections in the United States. August 2008. https://www.cdc.gov/nchhstp/newsroom/docs/fact-sheet-on-hiv-estimates.pdf (1.3 MB). Accessed August 25, 2016; CDC, National Center for HIV, Viral Hepatitis, STD, and TB Prevention, HIV/AIDS Surveillance System, 2009-2013.
Note: For this measure, lower rates are better. White, Black, Asian, NHOPI, and AI/AN are non-Hispanic. Hispanic includes all races.
- Importance: Determining the number of new cases helps to track the spread of HIV over time and can help identify target populations for public health interventions. Accurate estimates of new HIV infection rates are crucial for preventing the spread of the disease.
- Overall Rate: In 2013, the total rate of new HIV cases per 100,000 population for people age 13 and over was 17.9.
- Trends: From 2008 to 2013, the rates of new HIV cases decreased for Blacks, Hispanics, people of multiple races, and females. The rates increased for AI/ANs.
- Groups With Disparities:
- In all years, AI/ANs, Blacks, Hispanics, NHOPIs, and multiple-race people had higher rates of new HIV cases compared with Whites. The disparity between AI/ANs and Whites grew larger.
- In 3 of 6 years, Asians had a lower rate of new HIV cases compared with Whites.
- In all years, females had lower rates of new HIV cases compared with males.
HIV Treatment
Patients With HIV Who Received Pneumocystis Pneumonia Prophylaxis
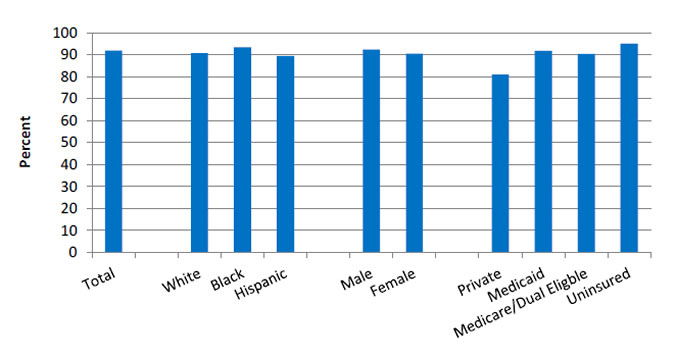
Adult patients with HIV and at least two CD4 cell counts of 200 or less who received Pneumocystis pneumonia prophylaxis during the last year, by race/ethnicity, sex, and insurance, 2012
Source: Agency for Healthcare Research and Quality, HIV Research Network, 2012.
- Importance: Pneumocystis pneumonia (PCP, formerly known as Pneumocystis carinii pneumonia) is an opportunistic infection that affects immunocompromised individuals, particularly those infected with HIV/AIDs. Before the widespread use of PCP prophylaxis, PCP infection was more common, resulting in greater numbers of hospital admissions and related increases in cost, morbidity, and mortality. Since 1992, CDC has recommended prophylaxis for individuals with CD4 T-cell counts below. The use of prophylaxis has increased survival rates for immunocompromised patients (Fishman, 1998).
- Overall Rate: In 2012, 91.9% of adult patients with HIV had at least two CD4 cell counts of 200 or less and received PCP prophylaxis during the last year. The percentage of Adult patients with HIV and at least two CD4 cell counts of 200 or less who received PCP during the last year follows for various groups:
- Whites, 90.8%.
- Blacks, 93.5%.
- Hispanics, 89.5%.
- Males, 92.4%.
- Females, 90.5%.
- Private insurance, 81.1%.
- Medicaid, 91.8%.
- Medicare/dual eligible, 90.4%.
- Uninsured, 95%.
- Groups With Disparities:
- In 2012, the percentage of adults with HIV and at least two CD4 cell counts of 200 or less who received PCP was higher for those with Medicaid (91.8%) and Medicare/dual eligible (90.4%) compared to those with private (81.1%) insurance.
HIV Awareness
People With HIV Who Know Their Serostatus
People living with HIV who know their serostatus, by race/ethnicity and gender, 2007-2011
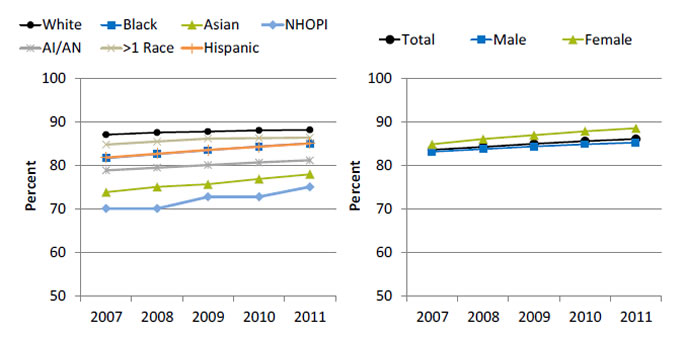
Left Chart:
| Race/Ethnicity | 2007 | 2008 | 2009 | 2010 | 2011 |
|---|---|---|---|---|---|
| White | 87.0 | 87.5 | 87.7 | 88.0 | 88.1 |
| Black | 81.6 | 82.5 | 83.4 | 84.3 | 85.0 |
| Asian | 73.8 | 75.0 | 75.6 | 76.8 | 77.9 |
| AI/AN | 78.8 | 79.4 | 80.0 | 80.6 | 81.1 |
| NHOPI | 70.0 | 70.0 | 72.7 | 72.7 | 75.0 |
| Hispanic | 81.7 | 82.6 | 83.5 | 84.2 | 85.0 |
| >1 Race | 84.7 | 85.4 | 86.1 | 86.2 | 86.3 |
Right Chart:
| Sex | 2007 | 2008 | 2009 | 2010 | 2011 |
|---|---|---|---|---|---|
| Total | 83.5 | 84.2 | 84.9 | 85.5 | 86.0 |
| Male | 83.1 | 83.7 | 84.3 | 84.8 | 85.2 |
| Female | 84.8 | 86.0 | 86.9 | 87.8 | 88.5 |
Source: National Center for HIV, Viral Hepatitis, STD, and TB Prevention, HIV/AIDS Surveillance System, 2007-2011.
- Importance: Those who are aware of a positive serostatus early on can gain early access to care and additional social services that can potentially improve quality of life. Also, knowledge of infection increases the likelihood of individuals to engage in safer sex practices with their partners compared with those who are unaware of their serostatus (CDC, 2013).
- Overall Rate: In 2011, the total percentage of people living with HIV who knew their serostatus was 86%.
- Trends: From 2007 to 2011, the percentage of people living with HIV who knew their serostatus improved for all racial/ethnic groups and both males and females.
- Groups With Disparities:
- In all years, the percentage of people living with HIV who knew their serostatus was lower for AI/ANs, Asians, Blacks, Hispanics, and NHOPIs compared with Whites.
- In all years, the percentage of people living with HIV who knew their serostatus was higher among women compared with men.
Viral Load Testing
People With HIV Who Had CD4 or Viral Load Tests
People with an HIV diagnosis who had at least two CD4 or viral load tests performed at least 3 months apart during the last year, 2009-2011
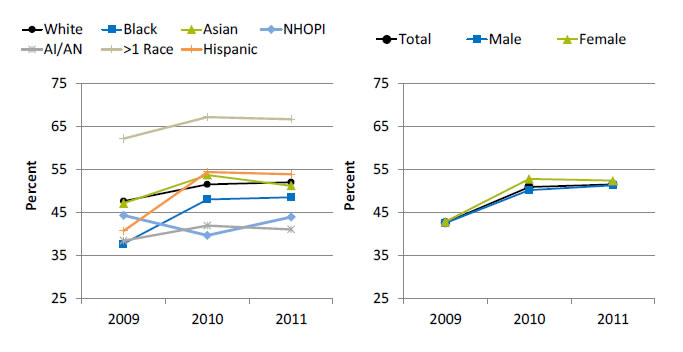
Left Chart:
| Race/Ethnicity | 2009 | 2010 | 2011 |
|---|---|---|---|
| White | 47.6 | 51.5 | 52.0 |
| Black | 37.7 | 48.0 | 48.5 |
| Asian | 47.1 | 53.7 | 51.2 |
| AI/AN | 38.4 | 41.9 | 41.0 |
| NHOPI | 44.3 | 39.6 | 43.9 |
| Hispanic | 40.7 | 54.4 | 53.9 |
| >1 Race | 62.2 | 67.2 | 66.7 |
Right Chart:
| Sex | 2009 | 2010 | 2011 |
|---|---|---|---|
| Total | 42.6 | 50.9 | 51.5 |
| Male | 42.5 | 50.2 | 51.3 |
| Female | 42.8 | 52.8 | 52.4 |
Source: National Center for HIV, Viral Hepatitis, STD, and TB Prevention, HIV/AIDS Surveillance System, 2009-2011.
- Importance: Checking the HIV viral load and CD4 T-cell count are methods of determining how well antiretroviral therapies are working to suppress the infection and for observing and managing HIV infection. Current treatment guidelines indicate that viral loads should be assessed at least every 3 months to determine whether the virus has been suppressed, and more often (every 4-8 weeks) if the patient’s medication regimen has changed (HHS, 2016).
- Overall Rate: In 2011, the total percentage of people with an HIV diagnosis who had at least two CD4 or viral load tests performed at least 3 months apart during the last year was 51.5%.
- Groups With Disparities:
- From 2009 to 2011, the percentage of people with an HIV diagnosis who had at least two CD4 or viral load tests performed at least 3 months apart during the last year was higher for multiple-race people compared with Whites. The percentage was lower for AI/ANs compared with Whites.
- In 2 of 3 years, the percentage of people with an HIV diagnosis who had at least two CD4 or viral load tests performed at least 3 months apart during the last year was lower for NHOPIs compared with Whites.
- There were no statistically significant differences by sex.
Viral Load
People With HIV With Viral Load Below 200
People with an HIV diagnosis in medical care whose most recent viral load in the last 12 months was <200 copies/mL, 2009-2011
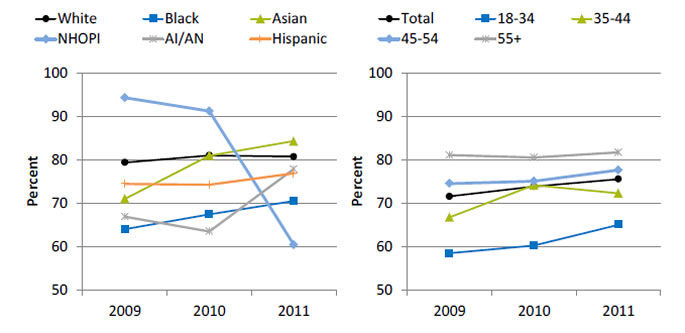
Left Chart:
| Race/Ethnicity | 2009 | 2010 | 2011 |
|---|---|---|---|
| White | 79.4 | 81.1 | 80.8 |
| Black | 64.1 | 67.5 | 70.6 |
| Asian | 71.1 | 81.0 | 84.4 |
| NHOPI | 94.4 | 91.3 | 60.5 |
| AI/AN | 66.9 | 63.6 | 78.0 |
| Hispanic | 74.5 | 74.3 | 76.9 |
Right Chart:
| Age | 2009 | 2010 | 2011 |
|---|---|---|---|
| Total | 71.6 | 73.9 | 75.6 |
| 18-34 | 58.5 | 60.3 | 65.1 |
| 35-44 | 66.8 | 74.2 | 72.3 |
| 45-54 | 74.6 | 75.1 | 77.7 |
| 55+ | 81.2 | 80.6 | 81.8 |
Source: National Center for HIV, Viral Hepatitis, STD, and TB Prevention, HIV/AIDS Surveillance System, Medical Monitoring Project, 2009-2011.
- Importance: Early access to care, effective HIV treatment, retention in care, and adherence to treatment regimens all help to increase viral load suppression. A suppressed viral load improves the health of people living with diagnosed HIV, increases survival, and reduces the risk of transmitting HIV to others. Patients with higher viral loads are at the highest risk of contracting opportunistic infections, experiencing non-AIDs morbidity, and dying. Initiating antiretroviral therapy (ART) is most critical for these patient groups (HHS, 2016).
- Overall Rate: In 2011, the total percentage of people with an HIV diagnosis in medical care whose most recent viral load in the last 12 months was less than 200 copies/mL was 75.6%.
- Groups With Disparities:
- From 2009 to 2011, the percentage of people with an HIV diagnosis in medical care whose most recent viral load in the last 12 months was less than 200 copies/mL was lower for Blacks compared with Whites.
- In all years, the percentage of people with an HIV diagnosis in medical care whose most recent viral load in the last 12 months was less than 200 copies/mL was lower for those ages 18-34 compared with those age 55 and over.
HIV Medication
People With HIV Who Were Prescribed Antiretroviral Therapy
People with an HIV diagnosis in medical care who were prescribed antiretroviral therapy in the last 12 months, 2009-2011
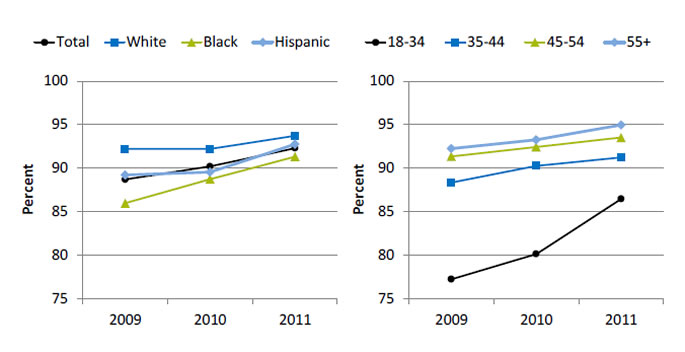
Left Chart:
| Race/Ethnicity | 2009 | 2010 | 2011 |
|---|---|---|---|
| Total | 88.7 | 90.2 | 92.3 |
| White | 92.2 | 92.2 | 93.7 |
| Black | 86.0 | 88.7 | 91.3 |
| Hispanic | 89.2 | 89.5 | 92.8 |
Right Chart:
| Age | 2009 | 2010 | 2011 |
|---|---|---|---|
| 18-34 | 77.2 | 80.1 | 86.5 |
| 35-44 | 88.3 | 90.3 | 91.2 |
| 45-54 | 91.4 | 92.4 | 93.5 |
| 55+ | 92.2 | 93.2 | 95.0 |
Source: National Center for HIV, Viral Hepatitis, STD, and TB Prevention, HIV/AIDS Surveillance System, Medical Monitoring Project, 2009-2011.
- Importance: Current treatment guidelines state that all HIV-infected people should receive anti-retroviral therapy (ART), also known as combination antiretroviral drug therapy (cART). ART decreases HIV-associated morbidity and mortality and helps to prevent transmission of the virus (HHS, 2016).
- Overall Rate: In 2011, the total percentage of people with an HIV diagnosis in medical care who were prescribed ART during the last 12 months was 92.3%.
- Groups With Disparities:
- From 2009 to 2011, the percentage of people with an HIV diagnosis in medical care who were prescribed ART during the last 12 months was lower for Blacks compared with Whites.
- In all years, the percentage of people with an HIV diagnosis in medical care who were prescribed ART during the last 12 months was lower for those ages 18-34 compared with those age 55 and over.
Deaths of People With HIV Infection
- A number of factors affect the death rate among people living with HIV, including:
- Underlying rates of HIV risk behaviors.
- Early detection and treatment of HIV disease.
- Management of HIV and its complications and comorbidities.
- With widespread use of antiretroviral therapy, a better understanding is needed of the patterns and risk factors for cause-specific mortality.
Hepatitis and Deaths of People Living With HIV
- An estimated one-third of people living with HIV are co-infected with hepatitis B or hepatitis C; hepatitis C is more common.
- Viral hepatitis progresses faster and causes more liver-related health problems in people with HIV than in those without HIV.
- Drug therapy has extended the life expectancy of people living with HIV, but liver disease has become the leading cause of non-AIDS-related death in this population (CDC, 2014).
- Hepatitis C increases the risk of death in people living with HIV by about 50% (Branch, et al., 2012).
- Current recommendations are to screen all people living with HIV for hepatitis C.
- Patients at high risk for hepatitis C should be screened annually and whenever this infection is suspected (AIDSinfo).
Antiretroviral Therapy and HIV Deaths
- ART has reduced the death rate of people living with HIV (PLWH), allowing their life expectancy to approach that of the general population.
- AIDS-related deaths in PLWH decrease with time on ART, but overall mortality among PLWH remains higher than in the general population.
- As the population of people living with HIV ages and time on ART increases, causes of death are changing:
- In high-income countries, deaths from cancer, cardiovascular disease, and liver disease have been identified among PLWH.
- It is important to study cause-specific mortality to clarify whether deaths result from effects of ART, prolonged exposure to HIV, restoration of CD4 counts after severe immunosuppression, or aging and non-HIV risk factors.
- Appropriate treatment based on the complex relationship between associated comorbidities and HIV disease could decrease mortality among PLWH and improve their quality of life (Ingle, et al., 2014).
HIV and Associated Comorbidities
- Pulmonary hypertension:
- For HIV-positive individuals, HIV proteins and HIV-related inflammation are associated with an increased risk of pulmonary hypertension (Triplette, et al., 2016).
- Frailty:
- HIV-related immunosenescence contributes to disease progression and adverse outcomes (Serrano-Villar, et al., 2016).
- Atherosclerosis:
- Protease inhibitors used to treat HIV are associated with intermediate factors that increase risk of cardiovascular disease (Bittencourt & Peixoto, 2015).
- Lower CD4 counts and higher plasma viral load have been shown to be important predictors of myocardial infarction (Bittencourt & Peixoto, 2015).
Number of Deaths Due to HIV Infection
Number of deaths due to HIV infection per 100,000 population, by race and sex, 2000-2011
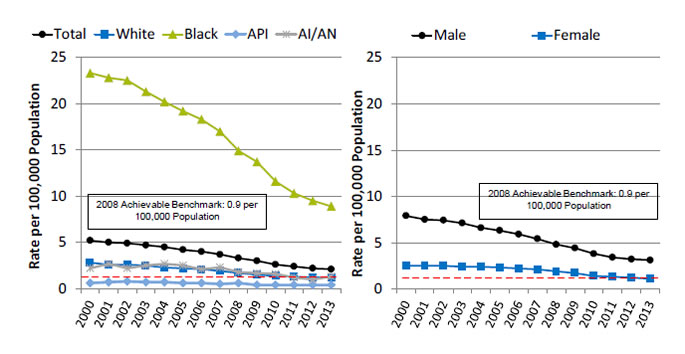
Left Chart:
| Race | 2000 | 2001 | 2002 | 2003 | 2004 | 2005 | 2006 | 2007 | 2008 | 2009 | 2010 | 2011 | 2012 | 2013 |
|---|---|---|---|---|---|---|---|---|---|---|---|---|---|---|
| Total | 5.2 | 5.0 | 4.9 | 4.7 | 4.5 | 4.2 | 4.0 | 3.7 | 3.3 | 3.0 | 2.6 | 2.4 | 2.2 | 2.1 |
| White | 2.8 | 2.6 | 2.6 | 2.5 | 2.3 | 2.2 | 2.1 | 1.9 | 1.7 | 1.5 | 1.4 | 1.3 | 1.2 | 1.2 |
| Black | 23.3 | 22.8 | 22.5 | 21.3 | 20.2 | 19.2 | 18.3 | 17.0 | 14.9 | 13.7 | 11.6 | 10.3 | 9.5 | 8.9 |
| API | 0.6 | 0.7 | 0.8 | 0.7 | 0.7 | 0.6 | 0.6 | 0.5 | 0.6 | 0.4 | 0.4 | 0.4 | 0.4 | 0.4 |
| AI/AN | 2.2 | 2.7 | 2.2 | 2.5 | 2.7 | 2.5 | 2.1 | 2.3 | 1.8 | 1.7 | 1.6 | 1.2 | 1.0 | 1.3 |
Right Chart:
| Sex | 2000 | 2001 | 2002 | 2003 | 2004 | 2005 | 2006 | 2007 | 2008 | 2009 | 2010 | 2011 | 2012 | 2013 |
|---|---|---|---|---|---|---|---|---|---|---|---|---|---|---|
| Male | 7.9 | 7.5 | 7.4 | 7.1 | 6.6 | 6.3 | 5.9 | 5.4 | 4.8 | 4.4 | 3.8 | 3.4 | 3.2 | 3.1 |
| Female | 2.5 | 2.5 | 2.5 | 2.4 | 2.4 | 2.3 | 2.2 | 2.1 | 1.9 | 1.7 | 1.4 | 1.3 | 1.2 | 1.1 |
2008 Achievable Benchmark: 0.9 per 100,000 Population.
Key: API = Asian or Pacific Islander, AI/AN = American Indian or Alaska Native.
Source: Centers for Disease Control and Prevention, National Center for Health Statistics, National Vital Statistics System—Mortality, 2000-2011.
Note: For this measure, lower rates are better. Rates are age adjusted to the 2000 U.S. standard population.
- Importance: Death rates are influenced by numerous factors, such as modes of transmission, transmission rates, rates of underlying behavioral risk factors, and effectiveness of disease management and treatment. The number of deaths due to HIV reflects the effectiveness of HIV treatment and ART adherence.
- Overall Rate: In 2013, the total rate of HIV infection deaths was 2.1 per 100,000 population.
- Trend: From 2000 to 2013, the HIV infection death rates were decreasing overall and for all racial/ethnic groups and both sexes.
- Groups With Disparities:
- From 2000 to 2013, HIV infection death rates were higher for Blacks than for Whites.
- In all years, APIs had lower rates than Whites.
- In all years, the rate of HIV infection deaths was higher for males than for females.
- Achievable Benchmark:
- The 2008 top 4 State achievable benchmark for HIV deaths was 0.9 per 100,000 population. The top 4 States that contributed to the achievable benchmark are Kansas, Minnesota, Oregon, and Wisconsin.
- Overall, it would take the total population 5 years to reach the benchmark. At the current rate, Whites, Blacks, and AI/ANs could achieve the benchmark in 2, 7, and 3 years, respectively. APIs have already reached the benchmark.
- Women would take 2 years and men would take 5 years to achieve the benchmark.
Ryan White HIV/AIDS Program Overview
- The Ryan White HIV/AIDS Program (RWHAP) provides funds for primary care and support services for people living with and affected by HIV.
- Working with States, cities, and local community organizations, RWHAP works to improve the quality of HIV-related care for those who lack sufficient health care coverage or financial resources to cope with HIV.
- For a second year, we present RWHAP data:
- Data presented are limited to those who received care through RWHAP.
- Data are not representative of the entire HIV population, which is estimated to be about 1.2 million people in the United States.
- For more information.
Ryan White Program Patients With Viral Load Below 200
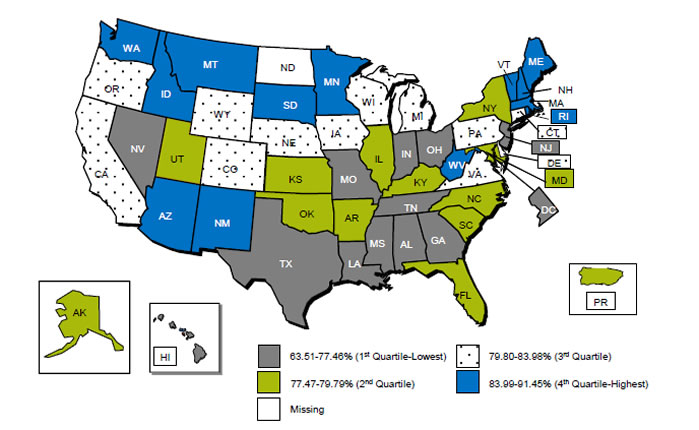
Ryan White HIV/AIDS Program: HIV patients with at least one HIV care visit and most recent viral load <200 during the year, 2013
Source: Health Resources and Services Administration, HIV/AIDS Bureau, 2013.
- Overall Rate:
- The number of HIV-positive clients with at least one HIV medical care visit and at least one viral load available was 283,189; 78.6% were virally suppressed (defined as most recent HIV RNA <200 copies/mL in the calendar year). It is important for RWHAP recipients and subrecipients focus on improving viral load suppression rates in their States, as well as comparing their performance with other States.
- Quartile ranges were as follows:
- 1st quartile (lowest): 63.51%-77.46% (AL, DC, GA, HI, IN, LA, MS, MO, NV, NJ, OH, TN, TX).
- 2nd quartile: 77.47%-79.79% (AK, AR, FL, IL, KS, KY, MD, NY, NC, OK, PR, SC, UT).
- 3rd quartile: 79.80%-83.98% (CA, CO, CT, DE, IA, MI, NE, OR, PA, VA, WI, WY).
- 4th quartile (Highest): 83.99%-91.45% ( AZ, ID, MA, ME, MN, MT, NH, NM, RI, SD, VT, WA, WV).
- Missing: ND.
- In 2013, most of the New England States were in the highest quartile for the percentage of RWHAP patients with at least one HIV care visit and most recent viral load of less than 200 during the year. Most of the Southeastern States were in the lowest quartile.
Ryan White Program Patients Retained in HIV Care, by Race/Ethnicity and Gender
Ryan White HIV/AIDS program: HIV patients who were retained in HIV care (at least 2 ambulatory visit dates at least 90 days apart), by race/ethnicity and gender
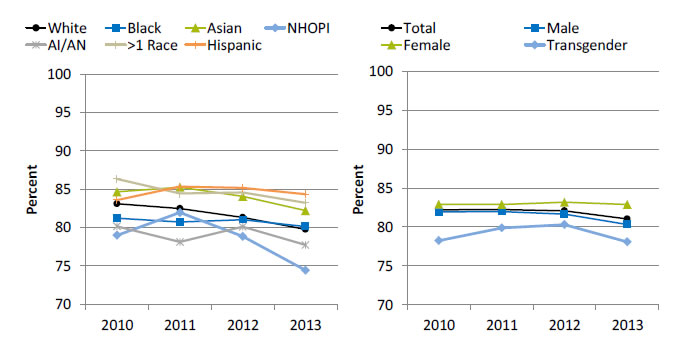
Left Chart:
| Race/Ethnicity | 2010 | 2011 | 2012 | 2013 |
|---|---|---|---|---|
| White | 83.1 | 82.5 | 81.3 | 79.8 |
| Black | 81.2 | 80.7 | 81.0 | 80.1 |
| Asian | 84.6 | 85.3 | 84.1 | 82.2 |
| NHOPI | 79.0 | 82.0 | 78.8 | 74.4 |
| AI/AN | 80.1 | 78.1 | 80.1 | 77.7 |
| >1 Race | 86.3 | 84.4 | 84.6 | 83.2 |
| Hispanic | 83.6 | 85.3 | 85.2 | 84.3 |
Right Chart:
| Gender | 2010 | 2011 | 2012 | 2013 |
|---|---|---|---|---|
| Total | 82.2 | 82.2 | 82.1 | 81.0 |
| Male | 82.0 | 82.0 | 81.7 | 80.3 |
| Female | 82.9 | 82.9 | 83.2 | 82.9 |
| Transgender | 78.2 | 79.9 | 80.3 | 78.1 |
Key: NHOPI = Native Hawaiian or Other Pacific Islander; AI/AN = American Indian or Alaska Native.
Source: Health Resources and Services Administration, HIV/AIDS Bureau, 2010-2013.
Note: Retained in care is defined as having at least two HIV medical care visit dates that were at least 90 days apart in the calendar year, with the first visit occurring before September 1. White, Black, Asian, NHOPI, and AI/AN are non-Hispanic. Hispanic includes all races.
- Overall Rate:
- The number of HIV-positive clients with at least one HIV medical care visit before September 1 and a second medical care visit at least 90 days apart during 2013 was 277,023. In 2013, 81.0% of RWHAP HIV patients were retained in care.
- Trend: From 2010 to 2013, the percentage of HIV-positive clients who were retained in care worsened for Whites, Asians, and multiple-race people.
- Groups With Disparities:
- In 3 of 4 years, Asian and multiple-race HIV-positive clients were more likely to be retained in care than White HIV-positive clients.
- In 2 of 4 years, Hispanic HIV-positive clients were more likely to be retained in care than White HIV-positive clients.
- In 2 of 4 years, AI/AN HIV-positive clients were less likely to be retained in care than White HIV-positive clients.
- In 2 of 4 years, female HIV-positive clients were more likely to be retained in care compared with male HIV-positive clients.
- The HIV/AIDS Bureau does not ask the sexual orientation of clients, but it collects variables that portray aspects of sexual orientation, including gender, transgender status, sex at birth, and client risk factors, such as men who have sex with men.
- Select for more information.
Ryan White Program Patients Retained in Care, by Income and Insurance
Ryan White HIV/AIDS program: HIV patients who were retained in HIV care (at least 2 ambulatory visit dates at least 90 days apart), by income and insurance
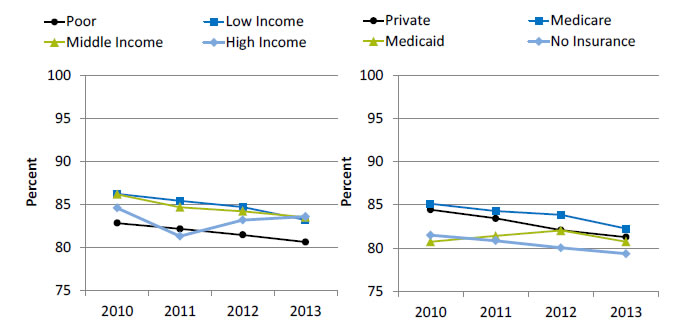
Left Chart:
| Income | 2010 | 2011 | 2012 | 2013 |
|---|---|---|---|---|
| Poor | 82.9 | 82.2 | 81.5 | 80.6 |
| Low Income | 86.3 | 85.4 | 84.7 | 83.2 |
| Middle Income | 86.2 | 84.7 | 84.2 | 83.5 |
| High Income | 84.6 | 81.3 | 83.2 | 83.6 |
Right Chart:
| Insurance | 2010 | 2011 | 2012 | 2013 |
|---|---|---|---|---|
| Private | 84.4 | 83.4 | 82.1 | 81.3 |
| Medicare | 85.1 | 84.3 | 83.8 | 82.2 |
| Medicaid | 80.7 | 81.4 | 82.0 | 80.7 |
| No Insurance | 81.5 | 80.8 | 80.0 | 79.3 |
Source: Health Resources and Services Administration, HIV/AIDS Bureau, 2010-2013.
Note: Retained in care is defined as having at least two HIV medical care visit dates that were at least 90 days apart in the calendar year, with the first visit occurring before September 1. Poor refers to household incomes below the Federal poverty line; low income, from the poverty line to just below 200% of the poverty line; middle income, 200% to just below 300% of the poverty line; and high, 300% of the poverty line and over
- Trend: From 2010 to 2013, the percentage of HIV-positive clients who were retained in care worsened for all income groups and those with private insurance, those with Medicare, and those who were uninsured.
- Groups With Disparities:
- In all years, HIV-positive clients from poor income households were less likely to be retained in care compared with those from high income households.
- In 3 of 4 years, HIV-positive clients with Medicare were more likely to be retained in care compared with those with private insurance.
References
AIDSInfo. Guidelines for the Prevention and Treatment of Opportunistic Infections in HIV-Infected Adults and Adolescents. Full Guideline, p. R-1. https://aidsinfo.nih.gov/guidelines/html/4/adult-and-adolescent-oi-prevention-and-treatment-guidelines/0. Accessed September 6, 2016.
Baral SD, Poteat T, Strömdahl S, et al. Worldwide burden of HIV in transgender women. Lancet Infect Dis 2013;13(3):214-22. PMID: 23260128. http://www.sciencedirect.com/science/article/pii/S1473309912703158. Accessed August 25, 2016.
Bittencourt MS, Peixoto D. Atherosclerosis in HIV patients: a different disease or more of the same? Atherosclerosis 2015;240(2):333-34.
Branch AD, Van Natta ML, Vachon ML, et al.; Studies of the Ocular Complications of AIDS Research Group. Mortality in hepatitis C virus-infected patients with a diagnosis of AIDS in the era of combination antiretroviral therapy. Clin Infect Dis 2012 Jul;55(1):137-44. Epub 2012 Apr 24. http://www.ncbi.nlm.nih.gov/pmc/articles/PMC3369565/. Accessed August 25, 2016.
Centers for Disease Control and Prevention. HIV Among Gay and Bisexual Men. July 2015a. http://www.cdc.gov/hiv/group/msm/index.html. Accessed August 25, 2016 .
Centers for Disease Control and Prevention. HIV Among Transgender People. April 2015b. http://www.cdc.gov/hiv/group/gender/transgender/index.html. Accessed August 25, 2016.
Centers for Disease Control and Prevention. HIV and Viral Hepatitis. March 2014. http://www.cdc.gov/hiv/pdf/library_factsheets_hiv_and_viral_hepatitis.pdf (329 KB). Accessed August 25, 2016.
Centers for Disease Control and Prevention. HIV in the United States: At A Glance. June 2016a. http://www.cdc.gov/hiv/statistics/basics/ataglance.html. Accessed August 25, 2016.
Centers for Disease Control and Prevention. Diagnoses of HIV infection in the United States and dependent areas, 2014. HIV Surveillance Report, Volume 26. November 2015c. http://https://www.cdc.gov/hiv/pdf/library/reports/surveillance/cdc-hiv-surveillance-report-us.pdf. Accessed August 25, 2016.
.Centers for Disease Control and Prevention. HIV Surveillance by Race/Ethnicity. https://npin.cdc.gov/node/322444 (6.34 MB). Last Reviewed August 26, 2016b. Accessed September 6, 2016.
Centers for Disease Control and Prevention. The Serostatus Approach. Essential Components of SAFE. September 2013. http://www.cdc.gov/hiv/research/seroststatusapproach/safe.html. Accessed August 25, 2016.
Colasanti J, Kelly J, Pennisi E, et al. Continuous retention and viral suppression provide further insights Into the HIV care continuum compared to the cross-sectional HIV care cascade. Clin Infect Dis 2016 Mar;62(5):648-54. Epub 2015 Nov 12. PMID: 26567263.
Fishman JA. Prevention of infection due to Pneumocystis carinii. Antimicrob Agents Chemother 1998 May;42(5):995-1004.
Grant JM Mottet LA, Tanis J, et al. Injustice at every turn: a report of the National Transgender Discrimination Survey. Washington, DC: National Center for Transgender Equality and National Gay and Lesbian Task Force; 2011.
Herbst JH, Jacobs ED, Finlayson TJ, et al. Estimating the HIV prevalence and risk behaviors of transgender persons in the United States: a systematic review. AIDS Behav 2008 Jan;12(1):1-17. Epub 2007 Aug 13. PMID:17694429.
Horberg MA, Hurley LB, Klein DB, et al. The HIV care cascade measured over time and by age, sex, and race in a large national integrated care system. AIDS Patient Care STDS 2015 Nov;29(11):582-90. PMID: 26505968.
Ingle SM, May MT, Gill MJ, et al. Impact of risk factors for specific causes of death in the first and subsequent years of antiretroviral therapy among HIV-infected patients. Clin Infect Dis 2014 Jul 15;59(2):287-97. Epub 2014 Apr 24. PMID: 24771333. http://www.ncbi.nlm.nih.gov/pmc/articles/PMC4073781/. Accessed August 25, 2016.
Moore R. Epidemiology of HIV infection in the United States: implications for linkage to care. Clin Infect Dis 2011;52(S2):S208-13. PMID: 21342909. http://www.ncbi.nlm.nih.gov/pmc/articles/PMC3106255/. Accessed August 25, 2016.
Panel on Antiretroviral Guidelines for Adults and Adolescents. Guidelines for the use of antiretroviral agents in HIV-1-infected adults and adolescents. Washington, DC: U.S. Department of Health and Human Services. http://aidsinfo.nih.gov/contentfiles/lvguidelines/AdultandAdolescentGL.pdf (4.78 MB). Accessed August 25, 2016.
Peters PJ, Pontones P, Hoover KW, et al. HIV infection linked to injection use of oxymorphone in Indiana, 2014–2015. New Engl J Med 2016;375(3):229-39.
Serrano-Villar S, Gutiérrez F, Miralles C, et al. HIV as a chronic disease: evaluation and management of non-AIDS defining conditions. Open Forum Infect Dis 2016 May 12;3(2):ofw097. https://www.ncbi.nlm.nih.gov/pmc/articles/PMC4943534/. Accessed August 25, 2016.
Stephens SC, Bernstein KT, Philip SS. Male to female transgender persons have different sexual risk behaviors yet similar rates of STDs and HIV. AIDS Behav 2011 Apr;15(3):683-6. PMID: 20694509.
Triplette M, Crothers K, Attia EF. (2016). Non-infectious pulmonary diseases and HIV. Curr HIV/AIDS Rep 2016;13(3):140-8.


