National Healthcare Quality and Disparities Report
Respiratory Disease Measures
- Process:
- Completion of tuberculosis therapy.
- Daily asthma medication.
- Written asthma management plans.
- Outcome: Emergency department visits for asthma.
Completion of Tuberculosis Therapy
- Incomplete tuberculosis therapy can lead to:
- Increased risk of treatment failure.
- Spread of infection to others.
- Development of drug-resistant strains of tuberculosis.
- The national goal for completion of treatment is:
- By 2015, 93% completion of treatment within 12 months among patients eligible for 6- to 9-month regimens (CDC, 2010).
Patients With Tuberculosis Who Completed Treatment Within 1 Year
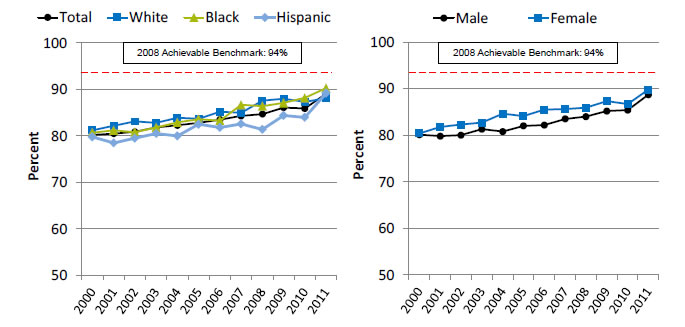
Patients with tuberculosis who completed a curative course of treatment within 1 year of initiation of treatment, by race/ethnicity and sex, 2000-2011
Left Chart:
| Race/Ethnicity | 2000 | 2001 | 2002 | 2003 | 2004 | 2005 | 2006 | 2007 | 2008 | 2009 | 2010 | 2011 |
|---|---|---|---|---|---|---|---|---|---|---|---|---|
| Total | 80.2 | 80.5 | 80.9 | 81.8 | 82.3 | 82.8 | 83.5 | 84.3 | 84.7 | 86.1 | 85.9 | 89.1 |
| White | 81.2 | 82.2 | 83.1 | 82.8 | 83.9 | 83.7 | 85.2 | 85.0 | 87.6 | 88.0 | 87.3 | 88.1 |
| Black | 80.7 | 81.2 | 80.8 | 81.8 | 82.9 | 83.6 | 83.3 | 86.7 | 86.4 | 87.1 | 88.2 | 90.3 |
| Hispanic | 79.8 | 78.5 | 79.5 | 80.5 | 80.0 | 82.5 | 81.8 | 82.6 | 81.4 | 84.4 | 84.0 | 89.2 |
Right Chart:
| Sex | 2000 | 2001 | 2002 | 2003 | 2004 | 2005 | 2006 | 2007 | 2008 | 2009 | 2010 | 2011 |
|---|---|---|---|---|---|---|---|---|---|---|---|---|
| Male | 80.1 | 79.8 | 80.0 | 81.3 | 80.8 | 82.0 | 82.2 | 83.5 | 84.0 | 85.2 | 85.4 | 88.7 |
| Female | 80.4 | 81.8 | 82.3 | 82.7 | 84.6 | 84.1 | 85.5 | 85.6 | 85.9 | 87.3 | 86.7 | 89.8 |
2008 Achievable Benchmark: 94%.
Source: Centers for Disease Control and Prevention, National Tuberculosis Surveillance System, 2000-2011.
Denominator: U.S. civilian noninstitutionalized population treated for tuberculosis.
Note: White and Black are non-Hispanic. Hispanic includes all races.
- Overall: In 2011, the overall percentage of patients who completed tuberculosis therapy within 1 year was 89.1%.
- Trends: The percentage of patients who completed tuberculosis therapy within 1 year increased from 80.2% in 2000 to 89.1% in 2011. Improvements were also observed among all major racial/ethnic groups and both sexes.
- Groups With Disparities:
- In 9 of 12 years, Hispanics were less likely than Whites to complete tuberculosis treatment.
- In 7 of 12 years, females were more likely than males to complete tuberculosis treatment.
- Achievable Benchmark:
- The 2008 top 4 State achievable benchmark was 94%. The top 4 States that contributed to the achievable benchmark are Colorado, Kansas, Mississippi, and Oregon.
- At the current annual rates of increase, Blacks and Hispanics could achieve the achievable benchmark in 3 years and 2 years, respectively. Whites show no progress toward the benchmark.
- Both men and women would need about 4 years.
Patients With Tuberculosis Who Completed Treatment Within 1 Year, Asian or Pacific Islander and Hispanic Subgroups
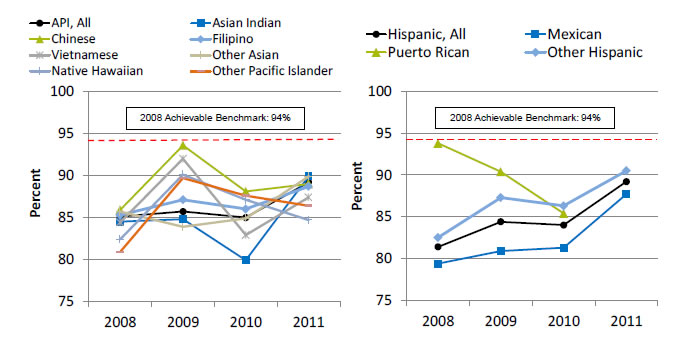
Patients with tuberculosis who completed a curative course of treatment within 1 year of initiation of treatment, by Asian or Pacific Islander and Hispanic granular ethnicities, 2008-2011
Left Chart:
| Ethnicity | 2008 | 2009 | 2010 | 2011 |
|---|---|---|---|---|
| API, All | 85.1 | 85.7 | 85.0 | 89.2 |
| Asian Indian | 84.5 | 84.8 | 79.9 | 89.9 |
| Chinese | 85.9 | 93.6 | 88.1 | 89.0 |
| Filipino | 85.3 | 87.1 | 86.0 | 88.7 |
| Vietnamese | 84.4 | 92.0 | 82.9 | 87.4 |
| Other Asian | 85.7 | 83.9 | 84.9 | 89.9 |
| Native Hawaiian | 82.4 | 90.1 | 87.1 | 84.7 |
| Other Pacific Islander | 80.9 | 89.7 | 87.6 | 86.4 |
Right Chart:
| Ethnicity | 2008 | 2009 | 2010 | 2011 |
|---|---|---|---|---|
| Hispanic, All | 81.4 | 84.4 | 84.0 | 89.2 |
| Mexican | 79.4 | 80.9 | 81.3 | 87.7 |
| Puerto Rican | 93.8 | 90.4 | 85.4 | |
| Other Hispanic | 82.5 | 87.3 | 86.3 | 90.5 |
2008 Achievable Benchmark: 94%.
Key: API = Asian or Pacific Islander.
Source: Centers for Disease Control and Prevention, National Tuberculosis Surveillance System, 2008-2011.
Denominator: U.S. civilian noninstitutionalized population treated for tuberculosis.
Note: The 2011 data for Puerto Ricans did not meet criteria for statistical reliability.
- Groups With Disparities:
- From 2008 to 2011, the percentage of Asian or Pacific Islander (API) and Hispanic granular ethnic groups who completed tuberculosis treatment showed some variability.
- For API groups, the percentage ranged from a low of 79.9% for Asian Indian patients in 2010 to a high of 93.6% for Chinese patients in 2009.
- For Hispanic ethnic groups, the percentage went from a low of 79.4% for Mexican patients in 2008 to a high of 93.8% for Puerto Rican patients in 2008.
- Despite the variability of earlier years, in 2011, there were no statistically significant differences between the API patient groups or the Hispanic patient groups who completed tuberculosis treatment.
- Achievable Benchmark:
- The 2008 top 4 State achievable benchmark was 94%. The top 4 States that contributed to the achievable benchmark are Colorado, Kansas, Mississippi, and Oregon.
- At the current annual rates of increase, all APIs could achieve the benchmark in about 4 years. For individual API ethnic groups, Filipinos, other Pacific Islanders, Asian Indians, and other Asians could reach the benchmark in about 6, 5, 4, and 3 years, respectively. Chinese, Vietnamese, and Native Hawaiian groups show no progress toward the benchmark.
- Mexicans and other Hispanics could reach the benchmark in about 4 years.
Daily Asthma Medication
- Improving care for people with asthma can reduce the incidence of asthma attacks and hospitalizations.
- The National Asthma Education and Prevention Program develops and disseminates science-based guidelines for asthma diagnosis and management (NHLBI, 2007).
- The guidelines are built around four essential components of asthma management critical for effective long-term control:
- Assessment and monitoring.
- Control of factors contributing to symptom exacerbation.
- Pharmacotherapy.
- Education for partnership in care.
- Some patients with asthma do not need medication.
- Patients with persistent asthma need daily long-term controller medication to prevent exacerbations and chronic symptoms.
- Preventive medications for people with persistent asthma include inhaled corticosteroids, inhaled long-acting beta-2 agonists, cromolyn, theophylline, and leukotriene modifiers.
People With Asthma Who Are Taking Preventive Medicine Daily
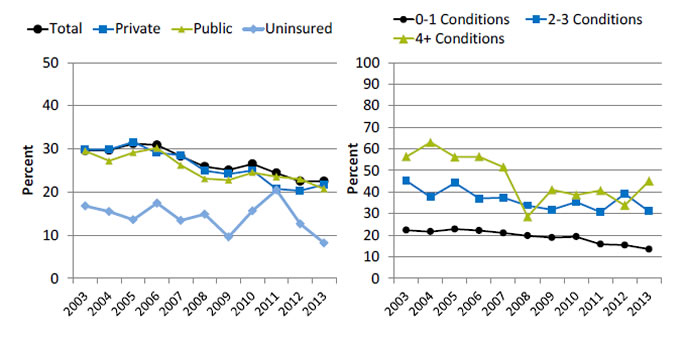
People with current asthma who are now taking preventive asthma medicine daily or almost daily (either oral or inhaler), by insurance (under age 65) and chronic conditions (age 18 and over), 2003-2013
Left Chart:
| Insurance | 2003 | 2004 | 2005 | 2006 | 2007 | 2008 | 2009 | 2010 | 2011 | 2012 | 2013 |
|---|---|---|---|---|---|---|---|---|---|---|---|
| Total | 29.6 | 29.7 | 31.2 | 30.9 | 28.3 | 25.9 | 25.1 | 26.5 | 24.4 | 22.5 | 22.5 |
| Private | 29.8 | 29.9 | 31.6 | 29.1 | 28.6 | 24.9 | 24.1 | 25.0 | 20.7 | 20.3 | 21.7 |
| Public | 29.5 | 27.2 | 29.1 | 30.2 | 26.2 | 23.1 | 22.8 | 24.5 | 23.5 | 23.0 | 20.7 |
| Uninsured | 16.7 | 15.5 | 13.5 | 17.4 | 13.4 | 14.9 | 9.6 | 15.6 | 20.4 | 12.6 | 8.2 |
Right Chart:
| No. of Conditions | 2003 | 2004 | 2005 | 2006 | 2007 | 2008 | 2009 | 2010 | 2011 | 2012 | 2013 |
|---|---|---|---|---|---|---|---|---|---|---|---|
| 0-1 Conditions | 22.3 | 21.6 | 22.8 | 22.1 | 21.0 | 19.7 | 18.9 | 19.3 | 15.8 | 15.4 | 13.5 |
| 2-3 Conditions | 45.2 | 37.6 | 44.2 | 37.0 | 37.4 | 33.7 | 31.8 | 35.3 | 30.6 | 39.1 | 31.0 |
| 4+ Conditions | 56.4 | 63.0 | 56.2 | 56.4 | 51.6 | 28.5 | 41.0 | 38.6 | 40.7 | 33.8 | 45.1 |
Source: Agency for Healthcare Research and Quality, Medical Expenditure Panel Survey, 2003-2013.
Denominator: Civilian noninstitutionalized population with current asthma.
Note: Age adjusted to the 2000 U.S. standard population using four age groups: 0-17, 18-44, 45-64, and 65 and over. People with current asthma report that they still have asthma or had an asthma attack in the last 12 months.
- Overall: In 2013, the overall percentage of people with current asthma who reported taking preventive asthma medicine daily or almost daily was 22.5%.
- Trends: From 2003 to 2013, the percentage of people with current asthma who reported taking preventive medicine daily or almost daily decreased:
- From 29.6% to 22.5% for total adult population.
- From 29.8% to 21.7% for those under age 65 with private insurance.
- From 29.5% to 20.7% for those under age 65 with public insurance.
- From 16.7% to 8.2% for those under age 65 with no insurance.
- From 22.3% to 13.5% for those age 18 and over with 0-1 chronic conditions.
- From 45.2% to 31.0% for those age 18 and over with 2-3 chronic conditions.
- From 56.4% to 45.1% for those age 18 and over with 4 or more chronic conditions.
- Groups With Disparities:
- In 9 of 11 years, among people under age 65 with current asthma, those who were uninsured were less likely than those with private insurance to take preventive medicine daily or almost daily.
- In all years, among people age 18 and over with current asthma, those with 2-3 chronic conditions and 4 or more chronic conditions were more likely than those with 0-1 chronic conditions to take preventive medicine daily or almost daily.
- Among people under age 65 with current asthma who reported taking preventive asthma medicine daily or almost daily, the disparity between uninsured people and those with private insurance grew smaller but was still present.
Written Asthma Management Plans
- To effectively partner with asthma patients in their care, providers need to teach them about daily management and how to recognize and handle worsening asthma.
- Providers should develop written asthma management plans, especially for:
- Patients with moderate or severe persistent asthma.
- Patients with a history of severe exacerbation.
People With Asthma Who Received a Written Asthma Management Plan
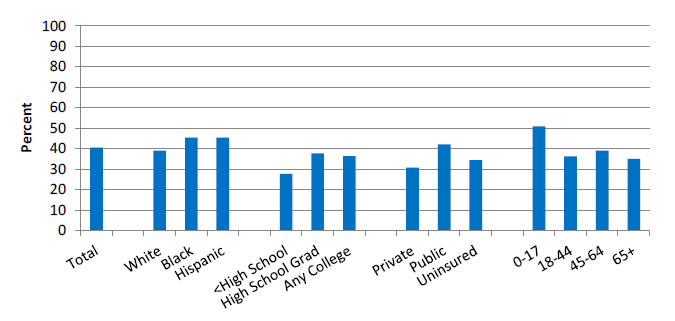
People with current asthma who received a written asthma management plan from their health provider, by race/ethnicity, education, health insurance status, and age, 2013
Source: Centers for Disease Control and Prevention, National Center for Health Statistics, National Health Interview Survey, 2013.
Denominator: Civilian noninstitutionalized population with current asthma.
Note: Estimates are age adjusted to the 2000 U.S. standard population. White and Black are non-Hispanic. Hispanic includes all races.
- Overall Rate: In 2013, 40.5% of people with current asthma received a written asthma management plan from their provider.
- Groups With Disparities:
- In 2013 Blacks (45.3%) and Hispanics (45.4%) were more likely than Whites (39%) to receive a written asthma management plan.
- In 2013, adults with less than a high school education (27.7%) were less likely than high school graduates (37.6%) and those with any college education (36.4%) to receive a written asthma management plan.
- In 2013, adults without insurance (34.4%) were more likely than adults with private insurance (30.7%) to receive a written asthma management plan.
- In 2013, children ages 0-17 (50.8%) were more likely than adults ages 18-44 (36.2%), 45-64 (39.0%), and 65 and over (34.9%) to receive a written asthma management plan from their provider.
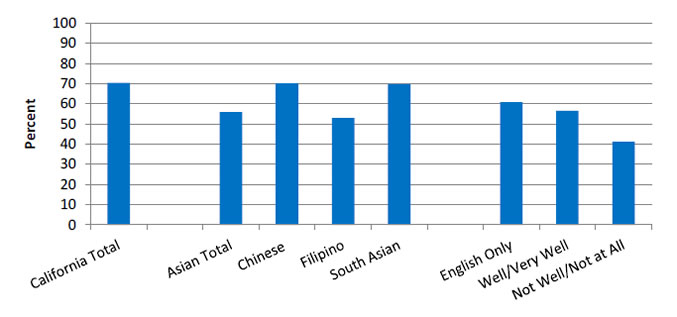
People With Asthma Whose Doctor Helped Them Develop an Asthma Management Plan, by Asian Subgroup and English Proficiency
People with current asthma whose doctor helped them develop an asthma management plan, by Asian subgroup and English proficiency (age 18+), California, 2011-2013, combined
Source: UCLA, Center for Health Policy Research, California Health Interview Survey, 2011-2013.
Denominator: Civilian noninstitutionalized population in California.
- Overall Rate: In California, in 2011-2013, 55.8% of Asian Californians with current asthma had a doctor who helped them develop an asthma management plan.
- Groups With Disparities:
- In 2011-2013, Asians (55.8%) were less likely than all Californians (70.4%) to have a doctor help them develop an asthma management plan.
- There were moderate variations among Asian subgroups and slight differences for Asians related to English proficiency; however, none of these differences were statistically significant due in part to large standard errors.
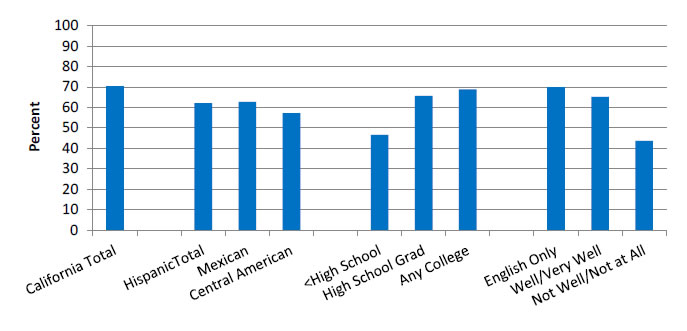
People With Asthma Whose Doctor Helped Them Develop an Asthma Management Plan, by Hispanic Subgroup and by Education and English Proficiency
People with current asthma whose doctor helped them develop an asthma management plan, by Hispanic subgroup and by education and English proficiency (age 18+), California, 2011-2013, combined
Source: UCLA, Centers for Health Policy Research, California Health Interview Survey, 2011-2013.
Denominator: Civilian noninstitutionalized population in California.
- Overall Rate: In California, in 2011-2013, 62.1% of Hispanics with current asthma had a doctor who helped them develop an asthma management plan.
- Groups With Disparities:
- In 2011-2013, Hispanics (62.1%) were less likely than all Californians (70.4%) to have a doctor help them develop an asthma management plan.
- In 2011-2013, among Hispanics, those with less than a high school education (46.5%) were less likely than high school graduates (65.7%) and those with any college education (68.8%) to have a doctor help them develop an asthma management plan.
- In 2011-2013, among Hispanics, those who did not speak English well (43.5%) were less likely than those who spoke English well or very well (65.1%) and those who spoke only English at home (69.9%) to report receiving help developing an asthma management plan.
Potentially Avoidable Emergency Department Visits
- The burden of asthma in the United States is high:
- About 2 million emergency department (ED) visits.
- More than 500,000 hospitalizations.
- Nearly 14 million physician office visits.
- More than 4,200 deaths.
- About $15 billion in direct medical costs.
- Asthma is difficult to manage and is associated with disparities in health outcomes, poor treatment adherence, and high health care costs.
- Improving care delivery is important to advance patient outcomes, avoid ED visits and hospitalizations, and reduce health care costs (Tapp, et al., 2011).
- Care coordination for asthma usually involves practice-based approaches, in which the care provider identifies and refers families to a care coordination program in the medical care facility.
- A more effective approach is to place care coordinators in the community as a bridge between families and health care providers:
- They can learn and better understand the contextual factors and issues that affect families.
- They can identify tailored support and services for optimal health care outcomes for asthma patients (Findley, et al., 2011).
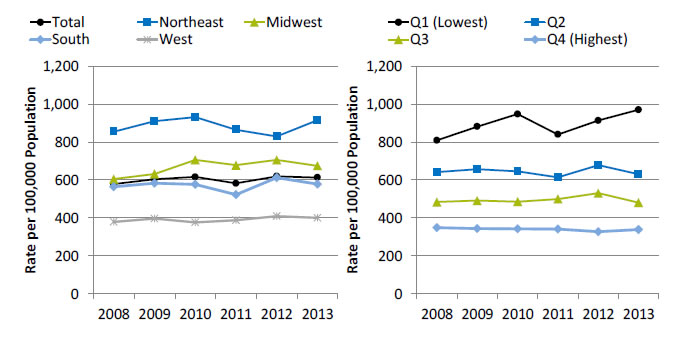
Emergency Department Visits for Asthma
Emergency department visits for asthma, ages 18-39, by hospital region and income, 2008-2013
Left Chart:
| Location | 2008 | 2009 | 2010 | 2011 | 2012 | 2013 |
|---|---|---|---|---|---|---|
| Total | 578.0 | 604.2 | 616.3 | 582.0 | 619.2 | 613.1 |
| Northeast | 854.4 | 909.3 | 931.0 | 864.6 | 829.3 | 914.8 |
| Midwest | 604.6 | 631.6 | 706.2 | 677.9 | 705.5 | 674.4 |
| South | 564.4 | 583.5 | 576.5 | 522.6 | 611.4 | 577.9 |
| West | 378.6 | 397.0 | 376.4 | 388.4 | 408.8 | 400.7 |
Right Chart:
| Income | 2008 | 2009 | 2010 | 2011 | 2012 | 2013 |
|---|---|---|---|---|---|---|
| Q1 (Lowest) | 808.6 | 881.3 | 947.4 | 839.5 | 913.0 | 969.6 |
| Q2 | 641.8 | 656.7 | 644.9 | 613.8 | 677.7 | 630.4 |
| Q3 | 483.7 | 491.4 | 485.8 | 499.6 | 530.2 | 480.6 |
| Q4 (Highest) | 348.3 | 343.3 | 342.4 | 341.2 | 327.6 | 338.8 |
Key: Q = quartile of median household income of the patient’s ZIP code of residence.
Source: Agency for Healthcare Research and Quality (AHRQ), Healthcare Cost and Utilization Project, Nationwide Inpatient Sample and AHRQ Quality Indicators, version 4.4, 2008-2013.
Note: Rates are age adjusted.
- Importance: Asthma exacerbations were responsible for approximately 2 million ED visits in 2012. ED visits for asthma exacerbation suggest a failure of prevention-oriented care since most asthma exacerbations are preventable with high-quality long-term management.
- Trends: From 2008 to 2013, the overall rate of ED visits for asthma increased from 578.0 to 613.1 per 100,000 population.
- Groups With Disparities:
- From 2008 to 2013, rates of ED visits for asthma were highest in the Northeast and lowest in the West. In 2013, the rate of ED visits for asthma in the Northeast was 914.8 per 100,000 population, followed by the Midwest (674.4 per 100,000 population), the South (577.9 per 100,000 population), and the West (400.7 per 100,000 population).
- In all years, adults with the highest income were significantly less likely than all other income groups to have an ED visit for asthma.
- Go to more information on care coordination related to ED visits for asthma.
References
Centers for Disease Control and Prevention. Monitoring tuberculosis programs: National Tuberculosis Indicator Project, United States, 2002-2008. MMWR 2010;59(10):295-8. http://www.cdc.gov/mmwr/preview/mmwrhtml/mm5910a3.htm. Accessed August 29, 2016.
Findley S, Rosenthal M, Bryant-Stephens T. Community-based care coordination: practical applications for childhood asthma. Health Promot Pract 2011 Nov;12(6 Suppl 1):52S-62S. PMID: 22068360.
National Heart, Lung, and Blood Institute, National Asthma Education and Prevention Program. Expert panel report 3: guidelines for the diagnosis and management of asthma. Full report 2007. Bethesda, MD: National Institutes of Health; 2007. Publication No. NIH 07-4051. http://www.nhlbi.nih.gov/guidelines/asthma/asthgdln.pdf (3.97 MB). Accessed August 29, 2016.
Tapp H, Herbert L, Dulin M. Comparative effectiveness of asthma interventions within a practice based research network. BMC Health Serv Res 2011 Aug 16;11:188. http://www.ncbi.nlm.nih.gov/pmc/articles/PMC3176175/. Accessed August 29, 2016.


