National Healthcare Quality and Disparities Report
Prevalence of Arthritis
- Arthritis is the leading cause of disability in the United States (CDC, 2006).
- About one in five adults and 300,000 children have a diagnosed arthritic condition (White and Waterman, 2012).
- Prevalence is projected to double by the year 2020 due largely to an aging population and an increasing prevalence of obesity (Johnson & Hunter, 2014).
- The Centers for Disease Control and Prevention predicts a 25% increase to 67 million U.S adults with some form of arthritis by 2030 (CDC, 2006).
Effects of Arthritis
- It is estimated that 41% of the 50 million U.S. adults living with arthritis report activity limitations caused by arthritis (Helmick, 2008).
- Arthritis usually affects people with other chronic conditions.
- For example, arthritis is found among 52% of people with diabetes, 57% of people with heart disease, and 53% of people with hypertension.
- Obese people with arthritis are 44% more likely not to be physically active compared with those without arthritis (White & Waterman, 2012).
Costs of Arthritis
- In 2007, the costs attributable to arthritis and other rheumatic conditions were $128 billion:
- $80.8 billion in direct medical expenditures ($115 billion in 2013 dollars).
- $47 billion in indirect lost earnings ($59.4 billion in 2013 dollars) (Ma, et al., 2014).
Chronic Joint Symptoms
- Estimates of arthritis prevalence vary depending on whether the definition includes chronic joint symptoms (pain, aching, joint stiffness).
- People with chronic joint symptoms report similar health outcomes as those with arthritis:
- Activity limitations.
- Poor/fair health and mental health.
- Similar health care use (Canizares & Badley, 2012).
- These patients need interventions and advice to manage and control their pain and symptoms and thus improve their health and quality of life (Canizares and Badley, 2012).
Measures
- Process: Adults with chronic joint symptoms who have ever seen a doctor or health professional for joint symptoms.
Treatment for Chronic Joint Symptoms
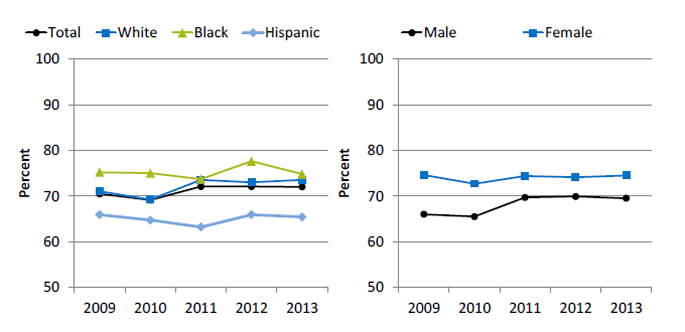
Adults With Chronic Joint Symptoms Who Have Seen a Doctor for Joint Symptoms, by Race/Ethnicity and Sex
Adults with chronic joint symptoms who have ever seen a doctor or other health professional for joint symptoms, by race/ethnicity and sex, 2009-2013

Left Chart:
| Race/Ethnicity | 2009 | 2010 | 2011 | 2012 | 2013 |
|---|---|---|---|---|---|
| Total | 70.5 | 69.1 | 72.1 | 72.1 | 72.0 |
| White | 71.0 | 69.2 | 73.5 | 73.0 | 73.5 |
| Black | 75.2 | 75.0 | 73.7 | 77.6 | 74.8 |
| Hispanic | 65.9 | 64.7 | 63.2 | 65.9 | 65.4 |
Right Chart:
| Sex | 2009 | 2010 | 2011 | 2012 | 2013 |
|---|---|---|---|---|---|
| Male | 66.0 | 65.5 | 69.7 | 69.9 | 69.5 |
| Female | 74.6 | 72.7 | 74.4 | 74.1 | 74.5 |
Source: Centers for Disease Control and Prevention, National Center for Health Statistics, National Health Interview Survey, 2009-2013.
Note: White and Black are non-Hispanic. Hispanic includes all races.
- Overall Rate: In 2013, 72.0% of adults with chronic joint symptoms reported seeing a doctor or other health professional for joint symptoms.
- Trends: The percentage of male adults with chronic joint symptoms who reported seeing a doctor of health professional for joint systems increased from 66.0% in 2009 to 69.5% in 2013.
- Groups With Disparities:
- In all years, Hispanics were less likely than Whites to report seeing a doctor or other health professional for joint symptoms.
- In all years, females were more likely than males to report seeing a doctor or other health professional for joint symptoms.
- From 2009 to 2013, there were no statistically significant changes in the disparity between White and Hispanic adults who reported seeing a doctor or health professional for joint symptoms.
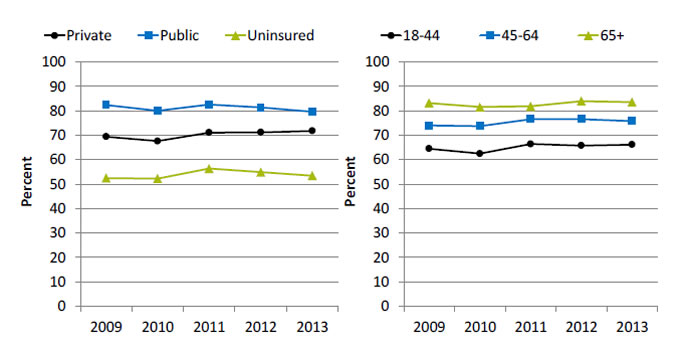
Adults With Chronic Joint Symptoms Who Have Seen a Doctor for Joint Symptoms, by Health Insurance and Age
Adults with chronic joint symptoms who have ever seen a doctor or other health professional for joint symptoms, by health insurance (age 18-64) and age, 2009-2013

Left Chart:
| Insurance | 2009 | 2010 | 2011 | 2012 | 2013 |
|---|---|---|---|---|---|
| Private | 69.4 | 67.6 | 71.1 | 71.2 | 71.8 |
| Public | 82.4 | 80.0 | 82.6 | 81.4 | 79.6 |
| Uninsured | 52.5 | 52.3 | 56.4 | 54.9 | 53.5 |
Right Chart:
| Age | 2009 | 2010 | 2011 | 2012 | 2013 |
|---|---|---|---|---|---|
| 18-44 | 64.5 | 62.5 | 66.4 | 65.8 | 66.2 |
| 45-64 | 74.0 | 73.7 | 76.6 | 76.6 | 75.8 |
| 65+ | 83.2 | 81.6 | 81.9 | 84.0 | 83.6 |
Source: Centers for Disease Control and Prevention, National Center for Health Statistics, National Health Interview Survey, 2009-2013.
- Groups With Disparities:
- In all years, adults without insurance were less likely to report seeing a doctor or health professional for joint symptoms than adults with private insurance.
- In all years, adults with public insurance were more likely to report seeing a doctor or health professional for joint symptoms than adults with private insurance.
- In all years, adults ages 45-64 and 65 and over were more likely to report seeing a doctor or health professional for joint symptoms compared with those ages 18-44.
- From 2009 to 2013, there were no statistically significant changes in the disparity between uninsured adults and privately insured adults who reported seeing a doctor or health professional for joint systems.
References
Canizares M, Badley E. Comparison of health-related outcomes for arthritis, chronic joint symptoms, and sporadic joint symptoms: a population-based study. Arthritis Care Res 2012 Nov;64(11):1708-14. http://onlinelibrary.wiley.com/doi/10.1002/acr.21735/full. Accessed August 29, 2016.
Centers for Disease Control and Prevention. Prevalence of doctor-diagnosed arthritis and arthritis-attributable activity limitation—United States, 2003-2005. MMWR 2006;55(40):1089-92.
Helmick CG, Felson DT, Lawrence RC, et al.; National Arthritis Data Workgroup. Estimates of the prevalence of arthritis and other rheumatic conditions in the United States. Part I. Arthritis Rheum 2008;58(1):15-25. http://onlinelibrary.wiley.com/doi/10.1002/art.23177/full. Accessed August 29, 2016.
Johnson V, Hunter D. The epidemiology of osteoarthritis. Best Pract Res Clin Rheumatol 2014;28:5-15. http://www.sciencedirect.com/science/article/pii/S1521694214000059. Accessed August 29, 2016.
Ma V, Chan L, Carruthers K. Incidence, prevalence, costs, and impact on disability of common conditions requiring rehabilitation in the United States: stroke, spinal cord injury, traumatic brain injury, multiple sclerosis, osteoarthritis, rheumatoid arthritis, limb loss, and back pain. Arch Phys Med Rehabil 2014;95:986-95. https://www.ncbi.nlm.nih.gov/pmc/articles/PMC4180670/. Accessed August 29, 2016.
White P, Waterman M. Making osteoarthritis a public health priority. Am J Nurs 2012 Mar;112(3 Suppl 1):S20-5. PMID:22373742.


