National Healthcare Quality and Disparities Report
Measures of Effective Treatment of Diabetes
- Process:
- Receipt of four recommended diabetes services.
- People with current diabetes who have a written diabetes management plan.
- Outcome:
- Adults age 40 and over with diabetes who felt confident they could control and manage their diabetes.
- Hospital admissions for uncontrolled diabetes.
- New cases of end stage renal disease due to diabetes.
Diabetes Treatment
Receipt of Recommended Services by Adults Age 40 and Over
Adults age 40 and over with diagnosed diabetes who received all four recommended services for diabetes in the calendar year (2+ hemoglobin A1c tests, foot exam, dilated eye exam, and flu shot), by race/ethnicity, 2008-2013
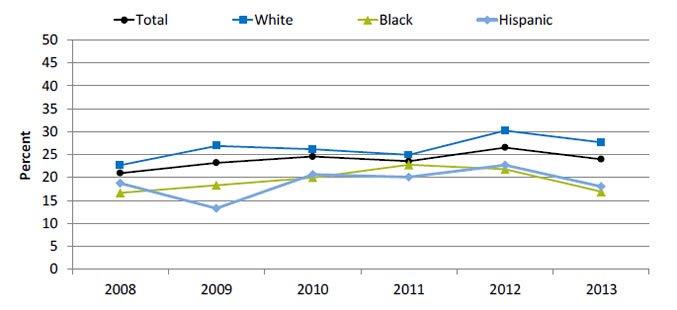
| Race/Ethnicity | 2008 | 2009 | 2010 | 2011 | 2012 | 2013 |
|---|---|---|---|---|---|---|
| Total | 21.0 | 23.2 | 24.6 | 23.6 | 26.6 | 24.0 |
| White | 22.7 | 26.9 | 26.2 | 25.0 | 30.3 | 27.7 |
| Black | 16.6 | 18.3 | 20.0 | 22.8 | 21.8 | 16.9 |
| Hispanic | 18.7 | 13.3 | 20.7 | 20.1 | 22.7 | 18.0 |
Source: Agency for Healthcare Research and Quality, Medical Expenditure Panel Survey, 2008-2013.
Denominator: Civilian noninstitutionalized population with diagnosed diabetes, age 40 and over.
Note: Data include people with both type 1 and type 2 diabetes. Percentages are age adjusted to the 2000 U.S. standard population using two age groups: 40-59 and 60 and over. White and Black are non-Hispanic. Hispanic includes all races.
- Importance:
- Regular hemoglobin A1c (HbA1c) tests, foot exams, dilated eye exams, and flu shots help people keep their diabetes under control and avoid diabetic complications.
- A composite measure is used to track the national rate of receipt of all four of these recommended annual diabetes interventions.
- Trends: From 2008 to 2013, among adults age 40 and over with diagnosed diabetes, there were no statistically significant improvements overall or among any racial/ethnic groups.
- Groups With Disparities: In 3 of 6 years, including 2012 and 2013, Hispanics and Blacks were less likely than Whites to receive the recommended services.
Receipt of Recommended Services by Adults Age 65 and Over, by Insurance
Adults age 65 and over with diagnosed diabetes who reported receiving four recommended services for diabetes in the calendar year (2+ hemoglobin A1c tests, foot exam, dilated eye, exam and flu shot), by insurance, 2008-2013
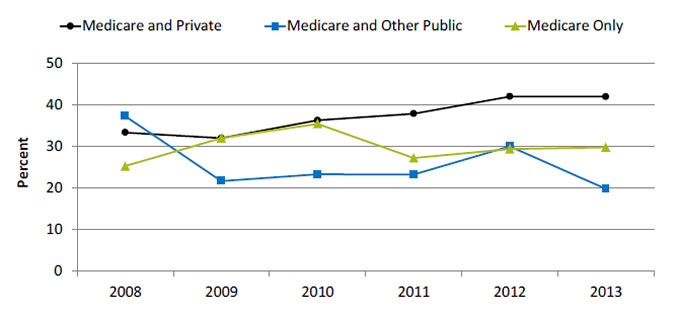
| Insurance | 2008 | 2009 | 2010 | 2011 | 2012 | 2013 |
|---|---|---|---|---|---|---|
| Medicare Only | 25.2 | 31.9 | 35.3 | 27.1 | 29.3 | 29.7 |
| Medicare and Private | 33.2 | 31.9 | 36.2 | 37.8 | 41.9 | 41.9 |
| Medicare and Other Public | 37.2 | 21.6 | 23.2 | 23.1 | 29.9 | 19.7 |
Source: Agency for Healthcare Research and Quality, Medical Expenditure Panel Survey, 2008-2013.
Denominator: Civilian noninstitutionalized population with diagnosed diabetes, age 65 and over.
Note: Data include people with both type 1 and type 2 diabetes.
- Importance: Diabetes prevalence increases with age, so monitoring older adults is important.
- Trends: From 2008 to 2013, improvement was observed for adults with Medicare and private insurance.
- Groups With Disparities:
- In the last 4 years, among adults age 65 and over, those with Medicare and other public insurance were less likely than those with Medicare and private insurance to receive all four recommended services.
- In the last 3 years, among adults age 65 and over, those with Medicare only were less likely than those with Medicare and private insurance to receive all four recommended services.
- Between 2008 and 2013, among adults age 65 and over, the gap between those with Medicare and private insurance and Medicare only grew, indicating worsening disparities.
- Between 2008 and 2013, among adults age 65 and over, the gap between those with Medicare and private insurance and Medicare and public insurance grew, indicating worsening disparities.
People With Diabetes Who Have a Diabetes Management Plan
People with current diabetes who have a written diabetes management plan, by Asian and Hispanic subpopulations and English proficiency, California, 2011-2013 combined
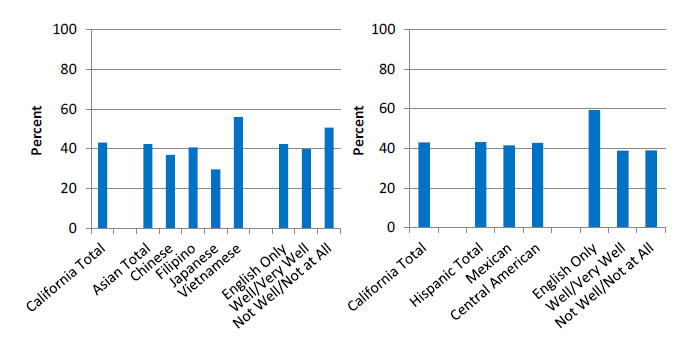
Source: UCLA, Center for Health Policy Research, California Health Interview Survey, 2011-2013.
Denominator: Civilian noninstitutionalized population in California.
- Importance:
- Self-care and perceived confidence to take action to manage chronic illness and to maintain such skills over time have been shown to be associated with better health outcomes (Ludman, et al., 2013).
- A successful partnership for diabetes care requires providers to educate patients about daily management of their diabetes. Thus, providers should develop a written diabetes management plan, especially for patients with a history of uncontrolled diabetes.
- National data on diabetes management and outcomes for some underserved populations are not available from the national data sources in the QDR. These populations include people with limited English proficiency; individuals who speak a language other than English at home; lesbian, gay, bisexual, and transgender individuals; and Asian and Hispanic subpopulations. To address some of these data gaps, we show additional data from the California Health Interview Survey.
- Overall Rate: Only 43.2% of Californians with current diabetes had a written diabetes management plan in 2011-2013.
- Groups With Disparities:
- Among Asian Californians with diabetes, the percentage who had a written diabetes management plan was 29.7% for Japanese, 36.9% for Chinese, 40.8% for Filipino, and 55.9% for Vietnamese people.
- Among Hispanic Californians with diabetes, those who spoke English well/very well and those who did not speak English well or at all were less likely than those who spoke English only to have a written diabetes management plan.
Diabetes Treatment Outcomes
Adults With Diabetes Who Felt Confident They Could Manage Their Diabetes
Adults age 40 and over with diabetes who felt confident they could control and manage their diabetes, by ethnicity and English proficiency, California, 2011-2013 combined
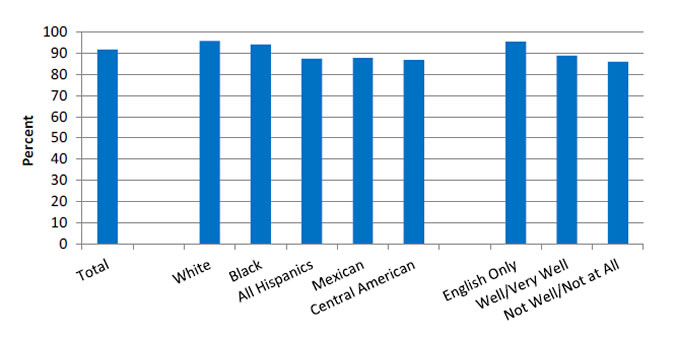
Source: UCLA, Center for Health Policy Research, California Health Interview Survey, 2011-2013.
Denominator: Civilian noninstitutionalized population in California.
- Importance: Self-care and perceived confidence in taking action to manage chronic illness and maintain such skills over time have been shown to be associated with better health outcomes (Ludman, et al., 2013).
- Overall Rate: In 2011-2013, 91.7% of California adults age 40 and over with diagnosed diabetes felt confident that they could control and manage their diabetes.
- Groups With Disparities:
- In 2011-2013, Hispanics of all races, Mexicans, and Central Americans were less likely than Whites to report that they felt confident they could control and manage their diabetes.
- California adults who spoke English well or very well and adults who did not speak English well or at all were less likely than adults who spoke only English to report that they felt confident they could control and manage their diabetes.
Hospital Admissions for Uncontrolled Diabetes, by Race/Ethnicity
Hospital admissions for uncontrolled diabetes without complications per 100,000 population, age 18 and over, by race/ethnicity, 2001-2013
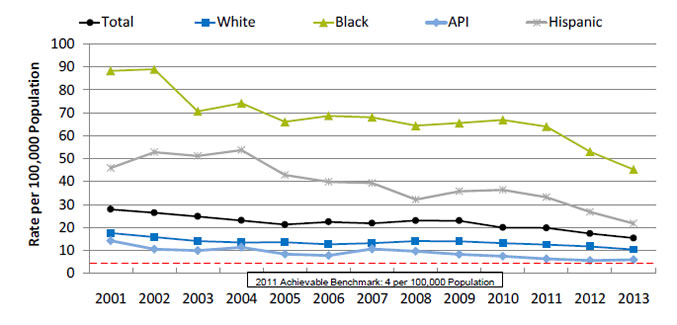
| Race/Ethnicity | 2001 | 2002 | 2003 | 2004 | 2005 | 2006 | 2007 | 2008 | 2009 | 2010 | 2011 | 2012 | 2013 |
|---|---|---|---|---|---|---|---|---|---|---|---|---|---|
| Total | 27.9 | 26.4 | 24.8 | 23.0 | 21.2 | 22.4 | 21.8 | 23.0 | 22.9 | 20.0 | 19.8 | 17.3 | 15.4 |
| White | 17.6 | 15.8 | 14.0 | 13.5 | 13.6 | 12.6 | 13.2 | 14.1 | 14.0 | 13.1 | 12.4 | 11.7 | 10.3 |
| Black | 88.3 | 89.1 | 70.6 | 74.2 | 66.1 | 68.7 | 68.1 | 64.4 | 65.5 | 66.9 | 64.0 | 53.1 | 45.3 |
| API | 14.2 | 10.4 | 9.9 | 11.3 | 8.3 | 7.7 | 10.6 | 9.6 | 8.2 | 7.3 | 6.2 | 5.5 | 5.9 |
| Hispanic | 46.0 | 52.9 | 51.1 | 53.8 | 42.9 | 39.8 | 39.3 | 32.2 | 35.8 | 36.4 | 33.1 | 26.7 | 21.7 |
2011 Achievable Benchmark: 4 per 100,000 Population.
Key: API = Asian or Pacific Islander.
Source: Agency for Healthcare Research and Quality, Healthcare Cost and Utilization Project, State Inpatient Databases, disparities analysis files and AHRQ Quality Indicators, version 4.4, 2001-2013.
Denominator: U.S. resident population age 18 and over.
Note: For this measure, lower rates are better. White and Black are non-Hispanic. Hispanic includes all races.
- Importance: Individuals who do not achieve good control of their diabetes may develop symptoms that require correction through hospitalization. Admission rates for uncontrolled diabetes may be reduced by better outpatient treatment and patients’ tighter adherence to the recommended diet and medication.
- Trends:
- The rate of hospital admissions for uncontrolled diabetes without complications per 100,000 population decreased from 27.9% in 2001 to 15.4% in 2013.
- From 2001 to 2013, the percentage of hospital admissions decreased for all populations:
- For Whites, from 17.6% to 10.3%.
- For Blacks, from 88.3% to 45.3%.
- For APIs, from 14.2% to 5.9%.
- For Hispanics, from 46.0% to 21.7%.
- Groups With Disparities: In all years, the rate of hospital admissions for uncontrolled diabetes was higher for Blacks and Hispanics and lower for Asians and Pacific Islanders (APIs) compared with Whites.
- Achievable Benchmark:
- The 2011 top 4 State achievable benchmark was 4 admissions per 100,000 population age 18 and over. The top 4 States that contributed to the achievable benchmark are Maine, Montana, Utah, and Vermont.
- At the current rate, the benchmark would not be met for the total population, Whites, and Blacks for approximately 15 years.
- APIs could reach the benchmark in 3 years and Hispanics in 7 years.
Hospital Admissions for Uncontrolled Diabetes, by Area Income
Hospital admissions for uncontrolled diabetes without complications per 100,000 population, age 18 and over, by area income, 2000-2013
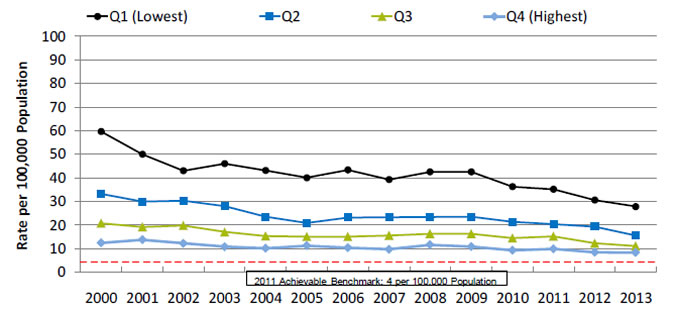
| Area Income | 2000 | 2001 | 2002 | 2003 | 2004 | 2005 | 2006 | 2007 | 2008 | 2009 | 2010 | 2011 | 2012 | 2013 |
|---|---|---|---|---|---|---|---|---|---|---|---|---|---|---|
| Q1 (Lowest) | 59.6 | 49.9 | 43.0 | 45.9 | 43.1 | 40.0 | 43.3 | 39.2 | 42.4 | 42.5 | 36.2 | 35.1 | 30.5 | 27.8 |
| Q2 | 33.2 | 29.9 | 30.3 | 27.9 | 23.5 | 20.9 | 23.1 | 23.2 | 23.4 | 23.5 | 21.3 | 20.3 | 19.2 | 15.6 |
| Q3 | 20.7 | 19.1 | 19.7 | 17.0 | 15.3 | 15.1 | 15.1 | 15.5 | 16.2 | 16.3 | 14.4 | 15.1 | 12.2 | 11.0 |
| Q4 (Highest) | 12.4 | 13.7 | 12.2 | 10.7 | 10.1 | 11.2 | 10.3 | 9.7 | 11.5 | 10.8 | 9.2 | 9.9 | 8.3 | 8.2 |
2011 Achievable Benchmark: 4 per 100,000 Population.
Key: Q = quartile.
Source: Agency for Healthcare Research and Quality, Healthcare Cost and Utilization Project, Nationwide Inpatient Sample and AHRQ Quality Indicators, version 4.4, 2000-2013.
Denominator: U.S. resident population age 18 and over.
Note: For this measure, lower rates are better. Area income is based on the median income of a patient’s ZIP Code of residence.
- Importance: Low-income neighborhoods may have insufficient health resources to meet the needs of all people with diabetes.
- Trends: From 2000 to 2013, the rates showed improvement for all income populations.
- Groups With Disparities:
- In all years, the rate of hospital admissions for uncontrolled diabetes was higher for residents of the lowest, second, and third income quartiles than for residents of the highest income quartile.
- Achievable Benchmark:
- The 2011 top 4 State achievable benchmark was 4 admissions per 100,000 population age 18 and over. The top 4 States that contributed to the achievable benchmark are Maine, Montana, Utah, and Vermont.
- At the current rates of improvement:
- Residents of the lowest income quartile could achieve the benchmark in less than 14 years.
- Residents of the second income quartile could achieve the benchmark in 11 years.
- Residents of the third income quartile could achieve the benchmark in less than 12 years.
- Residents of the highest income quartile could achieve the benchmark in less than 13 years.
Hospital Admissions for Uncontrolled Diabetes, by Race/Ethnicity, Stratified by Income
Hospital admissions for uncontrolled diabetes without complications per 100,000 population, age 18 and over, by race/ethnicity, stratified by income, 2013
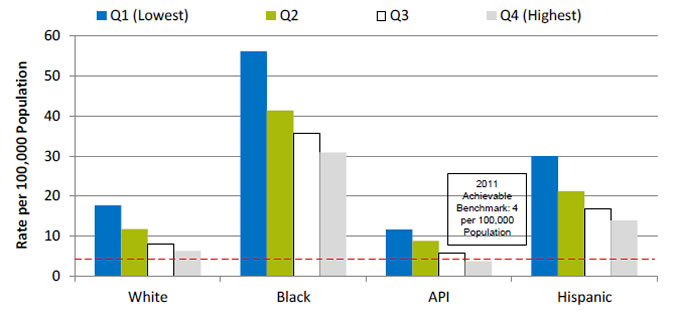
| Race/Ethnicity | Q1 (Lowest) | Q2 | Q3 | Q4 (Highest) |
|---|---|---|---|---|
| White | 17.7 | 11.8 | 7.9 | 6.3 |
| Black | 56.2 | 41.4 | 35.7 | 30.9 |
| API | 11.6 | 8.8 | 5.7 | 3.7 |
| Hispanic | 30 | 21.3 | 16.8 | 13.9 |
2011 Achievable Benchmark: 4 per 100,000 Population.
Key: API = Asian or Pacific Islander; Q = quartile of median household income of the patient’s ZIP code of residence.
Source: Agency for Healthcare Research and Quality, Healthcare Cost and Utilization Project, Nationwide Inpatient Sample and AHRQ Quality Indicators, version 4.4, 2013.
Denominator: U.S. resident population age 18 and over.
Note: For this measure, lower rates are better. Area income is based on the median income of a patient’s ZIP Code of residence.
- Importance: Low-income neighborhoods may have insufficient health resources to meet the needs of all people with diabetes.
- Groups With Disparities:
- In 2013, the rate of hospital admissions for uncontrolled diabetes was higher for Black and Hispanic residents than for White residents in all income quartiles.
- Black residents in the highest quartile had higher rates of hospital admissions for uncontrolled diabetes than White residents in the lowest income quartile.
- Achievable Benchmark:
- The 2011 top 4 State achievable benchmark was 4 admissions per 100,000 population age 18 and over. The top 4 States that contributed to the achievable benchmark are Maine, Montana, Utah, and Vermont.
- The only group to achieve the benchmark was API residents in the highest income quartile.
Hospital Admissions for Uncontrolled Diabetes, American Indians and Alaska Natives
Hospital admissions for uncontrolled diabetes per 100,000 population in IHS, Tribal, and contract hospitals, age 18 and over, by age, 2003-2014
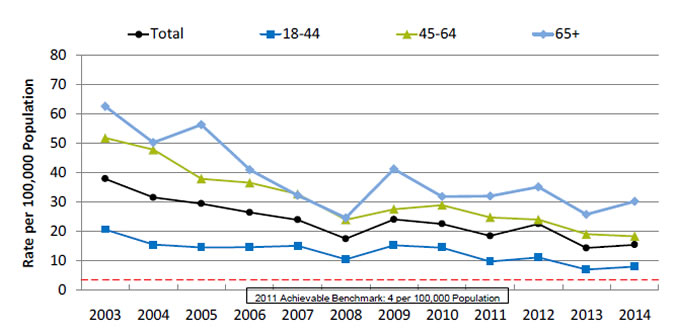
| Age | 2003 | 2004 | 2005 | 2006 | 2007 | 2008 | 2009 | 2010 | 2011 | 2012 | 2013 | 2014 |
|---|---|---|---|---|---|---|---|---|---|---|---|---|
| Total | 37.8 | 31.4 | 29.3 | 26.3 | 23.8 | 17.3 | 23.9 | 22.4 | 18.3 | 22.4 | 14.2 | 15.3 |
| 18-44 | 20.5 | 15.3 | 14.4 | 14.5 | 14.9 | 10.3 | 15.1 | 14.3 | 9.6 | 11.0 | 6.9 | 7.9 |
| 45-64 | 51.7 | 47.7 | 37.8 | 36.5 | 32.6 | 23.8 | 27.4 | 28.8 | 24.6 | 23.9 | 18.9 | 18.2 |
| 65+ | 62.5 | 50.1 | 56.2 | 40.9 | 32.2 | 24.5 | 41.1 | 31.7 | 31.9 | 35.0 | 25.6 | 30.1 |
2011 Achievable Benchmark: 4 per 100,000 Population.
Source: Indian Health Service, Office of Information Technology/National Patient Information Reporting System, National Data Warehouse, Workload and Population Data Mart, 2003-2014.
Note: For this measure, lower rates are better. Total estimates are age adjusted using the total U.S. population for 2000 as the U.S. standard population. Service population does not include the Portland and California regions.
- Importance:
- Diabetes is one of the leading causes of morbidity and mortality among American Indian and Alaska Native (AI/AN) populations. Its prevention and control are a major focus of the Indian Health Service (IHS) Director’s Chronic Disease Initiative and the IHS Health Promotion/Disease Prevention Initiative. Addressing barriers to health care is a large part of the overall IHS goal of ensuring that comprehensive, culturally acceptable personal and public health services are available and accessible to AI/ANs.
- AI/ANs who are members of federally recognized Tribes are eligible for services provided by IHS. About 2 million AI/ANs in the United States receive care directly from IHS, through tribally contracted and operated health programs or through services purchased by IHS from other providers. Due to low numbers and lack of data, information about AI/AN hospitalizations is difficult to obtain in most Federal and State hospital utilization data sources. The QDR addresses this gap by examining utilization data from IHS, Tribal, and contract hospitals.
- Trends: From 2003 to 2014, the age-adjusted rate of hospitalizations for uncontrolled diabetes in IHS, Tribal, and contract hospitals decreased overall and among all age groups.
- Groups With Disparities: In all years, patients ages 18-44 had lower rates than patients ages 45-64 and 65 and over.
- Achievable Benchmark:
- The 2011 top 4 State achievable benchmark was 4 admissions per 100,000 population age 18 and over. The top 4 States that contributed to the achievable benchmark are Maine, Montana, Utah, and Vermont.
- At the current rates, the benchmark could be met overall in 7 years, by patients ages 18-44 in 4 years, ages 45-64 in 5 years, and age 65 and over in 10 years.
End Stage Renal Disease Due to Diabetes
New cases of end stage renal disease due to diabetes per million population, by race and ethnicity, 2003-2013
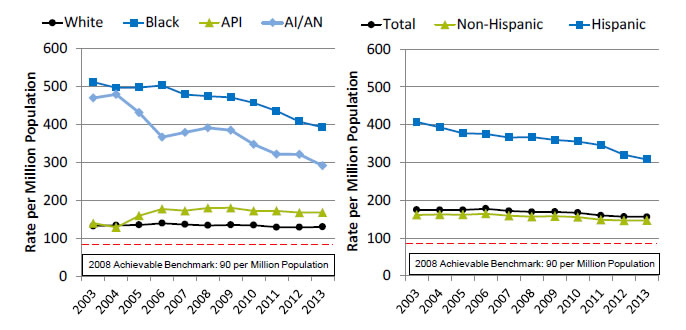
Left Chart:
| Race | 2003 | 2004 | 2005 | 2006 | 2007 | 2008 | 2009 | 2010 | 2011 | 2012 | 2013 |
|---|---|---|---|---|---|---|---|---|---|---|---|
| White | 132.2 | 134.2 | 135.1 | 139.6 | 136.3 | 134.0 | 135.0 | 134.4 | 129.1 | 128.8 | 130.0 |
| Black | 511.2 | 496.4 | 497.1 | 502.9 | 478.5 | 474.2 | 471.4 | 456.9 | 435.4 | 407.2 | 392.7 |
| AI/AN | 469.3 | 478.9 | 431.1 | 366.4 | 378.8 | 391.1 | 384.3 | 347.5 | 321.5 | 320.9 | 291.6 |
| API | 139.7 | 128.9 | 159.7 | 177.2 | 172.7 | 179.7 | 180.0 | 172.3 | 172.4 | 167.5 | 167.9 |
Right Chart:
| Ethnicity | 2003 | 2004 | 2005 | 2006 | 2007 | 2008 | 2009 | 2010 | 2011 | 2012 | 2013 |
|---|---|---|---|---|---|---|---|---|---|---|---|
| Total | 174.4 | 174.2 | 174.2 | 177.6 | 171.7 | 169.1 | 169.6 | 166.9 | 159.5 | 156.4 | 155.9 |
| Hispanic | 407.5 | 393.8 | 377.7 | 375.5 | 366.2 | 367.7 | 359.8 | 355.8 | 346.1 | 320.5 | 308.2 |
| Non-Hispanic | 161.3 | 162.1 | 162.0 | 164.4 | 158.9 | 156.5 | 157.8 | 155.2 | 148.1 | 146.4 | 146.8 |
2008 Achievable Benchmark: 90 per Million Population.
Key: API = Asian or Pacific Islander; AI/AN = American Indian or Alaska Native.
Source: National Institute of Diabetes and Digestive and Kidney Diseases, U.S. Renal Data System, 2003-2013.
Denominator: U.S. resident population.
Note: For this measure, lower rates are better. Rates are adjusted by age, sex, race, and interactions of age, sex, and race. When reporting is by race and ethnicity, the adjustment is by age, sex, and interactions of age and sex. Hispanic and non-Hispanic include all races.
- Importance: Diabetes is the most common cause of kidney failure. Keeping blood glucose levels under control can prevent or slow the progression of kidney disease. When kidney disease is detected early, medication can slow the disease’s progress; when detected late, it commonly progresses to end stage renal disease (ESRD) requiring dialysis or kidney transplantation. While some cases of kidney failure due to diabetes cannot be avoided, other cases reflect inadequate control of blood glucose or delayed detection and treatment of early kidney disease due to diabetes.
- Trends: From 2003 to 2013, the overall rate of new cases of ESRD due to diabetes improved from 174.4 to 155.9 per million population. Hispanics improved from 407.5 to 308.2, Blacks improved from 511.2 to 392.7, and AI/ANs improved from 469.3 to 291.6 per million population.
- Groups With Disparities: In all years, Blacks and AI/ANs had higher rates than Whites, and Hispanics had higher rates than non-Hispanics.
- Achievable Benchmark:
- The 2008 top 5 State achievable benchmark was 90 per million population. The top 5 States that contributed to the achievable benchmark are Alaska, Maine, New Hampshire, Rhode Island, and Vermont.
- At current rates of change, the benchmark would not be achieved overall or by any racial or ethnic group for decades.
National Quality Strategy Priorities in Action: Effective Treatment of Diabetes
- Priorities in Action features some of our Nation's most promising and transformative quality improvement programs.
- The Wind River Reservation in Wyoming is the home of the Eastern Shoshone and Northern Arapaho Tribes.
- The reservation is in the heart of the Northern Plains in southwestern Wyoming.
- About 12,500 residents live on the reservation; 12 percent have diabetes and 71 percent are clinically obese.
- In 2009, the Eastern Shoshone Tribal Health Department received a grant to create a community-clinical partnership on the reservation to:
- Address barriers to diabetes management and prevention.
- Create a comprehensive system of care to help tribal members with or at risk of diabetes manage their condition and improve outcomes.
- The 5-year grant was in partnership with the Northern Arapaho Tribe, Indian Health Service, and Sundance Research Institute.
- The system of care included education and support services.
Reference
Ludman EJ, Peterson D, Katon WJ, et al. Improving confidence for self care in patients with depression and chronic illnesses. Behav Med 2013;391(1):1-6. https://www.ncbi.nlm.nih.gov/pmc/articles/PMC3628828/. Accessed August 29, 2016.


