National Healthcare Quality and Disparities Report
Measures of Clinical Preventive Services: Screening
- Women ages 21-65 years who received a Pap smear in the last 3 years.
- Invasive cervical cancer incidence per 100,000 women age 20 and over.
- Adults who received a blood pressure measurement in the last 2 years and can state whether their blood pressure was normal or high.
Clinical preventive services include screening for early detection of cancer and cardiovascular disease.
Receipt of Pap Smear
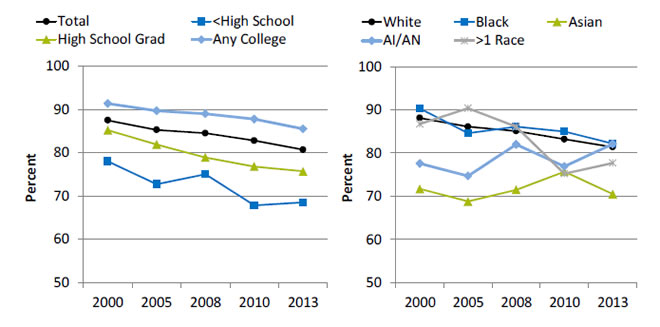
Women ages 21-65 years who received a Pap smear in the last 3 years, by education and race, 2000-2013
Left Chart:
| Education | 2000 | 2005 | 2008 | 2010 | 2013 |
|---|---|---|---|---|---|
| Total | 87.5 | 85.3 | 84.5 | 82.8 | 80.7 |
| <High School | 78.0 | 72.7 | 75.0 | 67.8 | 68.5 |
| High School Grad | 85.2 | 81.9 | 78.9 | 76.8 | 75.7 |
| Any College | 91.4 | 89.7 | 89.0 | 87.8 | 85.5 |
Right Chart:
| Race | 2000 | 2005 | 2008 | 2010 | 2013 |
|---|---|---|---|---|---|
| White | 88.1 | 86.1 | 85.1 | 83.2 | 81.4 |
| Black | 90.3 | 84.6 | 86.1 | 85.0 | 82.2 |
| Asian | 71.7 | 68.8 | 71.5 | 75.7 | 70.5 |
| AI/AN | 77.6 | 74.7 | 82.0 | 76.9 | 82.1 |
| >1 Race | 86.7 | 90.4 | 86.1 | 75.2 | 77.7 |
Key: AI/AN = American Indian or Alaska Native.
Source: Centers for Disease Control and Prevention, National Center for Health Statistics, National Health Interview Survey, 2000-2013.
Denominator: Women ages 21-65.
Note: Measure is age adjusted. Data for this measure are not collected every year.
- Importance: Screening with Pap smears can detect high-grade precancerous cervical lesions that can be removed before they become cancerous.
- Overall: In 2013, 80.7% of women ages 21-65 had received a Pap smear in the last 3 years.
- Trends: From 2000 to 2013, the percentage of women ages 21-65 years who received a Pap smear in the last 3 years decreased overall, among all education groups, and among Black and White women.
- Groups With Disparities: In all years, the percentage of women who received a Pap smear was lower:
- Among Asian women compared with White women. From 2000 to 2013, the disparity grew smaller, but it was still present in 2013.
- Among women with less than a high school education and high school graduates compared with women with any college. From 2000 to 2013, there were no statistically significant differences in the disparities.
Invasive Cervical Cancer Incidence
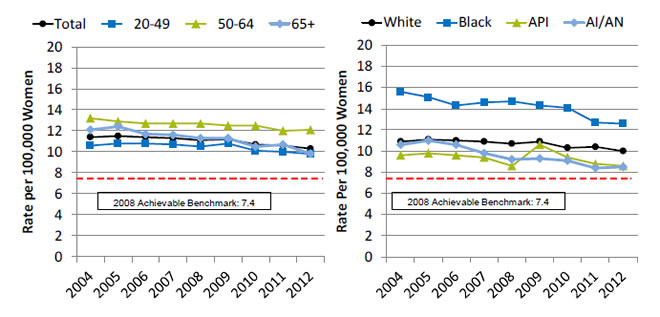
Invasive cervical cancer incidence per 100,000 women age 20 years and over, by age and race, 2004-2012
Left Chart:
| Age | 2004 | 2005 | 2006 | 2007 | 2008 | 2009 | 2010 | 2011 | 2012 |
|---|---|---|---|---|---|---|---|---|---|
| 20-49 | 10.6 | 10.8 | 10.8 | 10.7 | 10.5 | 10.8 | 10.1 | 10.0 | 9.8 |
| 50-64 | 13.2 | 12.9 | 12.7 | 12.7 | 12.7 | 12.5 | 12.5 | 12.0 | 12.1 |
| 65+ | 12.1 | 12.4 | 11.7 | 11.6 | 11.3 | 11.3 | 10.5 | 10.7 | 9.8 |
| Total | 11.4 | 11.5 | 11.4 | 11.3 | 11.1 | 11.2 | 10.7 | 10.6 | 10.3 |
Right Chart:
| Race | 2004 | 2005 | 2006 | 2007 | 2008 | 2009 | 2010 | 2011 | 2012 |
|---|---|---|---|---|---|---|---|---|---|
| White | 10.9 | 11.1 | 11.0 | 10.9 | 10.7 | 10.9 | 10.3 | 10.4 | 10.0 |
| Black | 15.6 | 15.1 | 14.3 | 14.6 | 14.7 | 14.3 | 14.1 | 12.7 | 12.6 |
| API | 9.6 | 9.8 | 9.6 | 9.4 | 8.6 | 10.6 | 9.4 | 8.8 | 8.6 |
| AI/AN | 10.6 | 11.0 | 10.6 | 9.8 | 9.2 | 9.3 | 9.1 | 8.4 | 8.5 |
2008 Achievable Benchmark: 7.4.
Key: API = Asian or Pacific Islander; AI/AN = American Indian or Alaska Native.
Source: Centers for Disease Control and Prevention and the National Cancer Institute, National Program of Cancer Registries, United States Cancer Statistics, 2004-2012.
Denominator: Women age 20 and over.
Note: Measure is age adjusted. Lower rates are better.
- Importance: Since the implementation of widespread screening with Pap smears, rates of invasive cervical cancer have fallen dramatically. Most cases now occur among women who have not been appropriately screened.
- Overall: In 2012, the overall rate of invasive cervical cancer per 100,000 women age 20 years and over was 10.3.
- Trends: From 2004 to 2012, rates of invasive cervical cancer fell overall and among all age groups and racial/ethnic groups.
- Groups With Disparities:
- In 2012, rates of invasive cervical cancer were higher:
- Among women ages 50-64 compared with women ages 20-49.
- Among Black women compared with White women. From 2004 to 2012, this disparity grew smaller, but it was still present in 2012.
- In 2012, rates of invasive cervical cancer were lower among Asian and Pacific Islander women compared with White women.
- In 2012, rates of invasive cervical cancer were higher:
- Achievable Benchmark:
- The 2008 top 5 State achievable benchmark was 7.4 per 100,000 women. The top 5 States that contributed to the achievable benchmark are Connecticut, Kansas, Massachusetts, Utah, and Wisconsin.
- At the current annual rates of decrease, this benchmark would not be attained for more than 14 years overall and approximately 18 years for people ages 20-49 and 50-64. Most racial groups could achieve it within 15 years. API women could achieve the benchmark in 3 years and women age 65 and over could achieve it in 6 years.
Receipt and Understanding of Blood Pressure Measurement
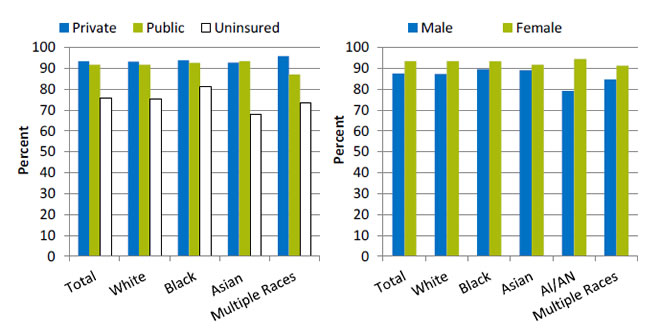
Adults who received a blood pressure measurement in the last 2 years and can state whether their blood pressure was normal or high, by insurance and gender, stratified by race/ethnicity, 2012
Left Chart:
| Insurance | Total | White | Black | Asian | Multiple Races |
|---|---|---|---|---|---|
| Private | 93.4 | 93.3 | 93.9 | 92.9 | 95.9 |
| Public | 91.7 | 91.8 | 92.7 | 93.6 | 87 |
| Uninsured | 75.9 | 75.1 | 81.5 | 68.1 | 73.7 |
Right Chart:
| Sex | Total | White | Black | Asian | AI/AN | Multiple Races |
|---|---|---|---|---|---|---|
| Male | 87.5 | 87.3 | 89.6 | 89.2 | 79.2 | 84.7 |
| Female | 93.5 | 93.6 | 93.4 | 91.8 | 94.6 | 91.3 |
Source: Centers for Disease Control and Prevention, National Center for Health Statistics, National Health Interview Survey, 2012.
Denominator: Adult civilian noninstitutionalized population.
Note: White and Black are non-Hispanic. Hispanic includes all races. Measure is age adjusted.
- Importance: Early detection and treatment of high blood pressure can prevent heart failure, kidney failure, and stroke. Because high blood pressure typically causes no symptoms, screening is essential.
- Overall: In 2012, the percentage of adults who received a blood pressure measurement in the last 2 years and can state whether their blood pressure was normal or high was 90.6% (data not shown).
- Groups With Disparities:
- In 2012, overall, the percentage of adults who received a blood pressure measurement was lower for people with public insurance and those who were uninsured compared with people with private insurance.
- In 2012, for all races, the percentage of adults who received a blood pressure measurement was lower for people who were uninsured compared with people with private insurance.
- In 2012, the percentage of adults who received a blood pressure measurement was higher for females compared with males overall and for Whites, Blacks, and American Indians and Alaska Natives.
Measures of Clinical Preventive Services: Immunization
- Adults age 65 years and over who ever received pneumococcal immunization.
- Hospital patients who received:
- Pneumococcal immunization.
- Influenza immunization.
- Long-stay nursing home residents who were assessed and appropriately given:
- Pneumococcal immunization.
- Influenza immunization.
Important adult immunizations include pneumococcal and influenza immunization. Childhood and adolescent immunizations are presented in the section of this chartbook on Maternal and Child Health Care.
Receipt of Pneumococcal Immunization
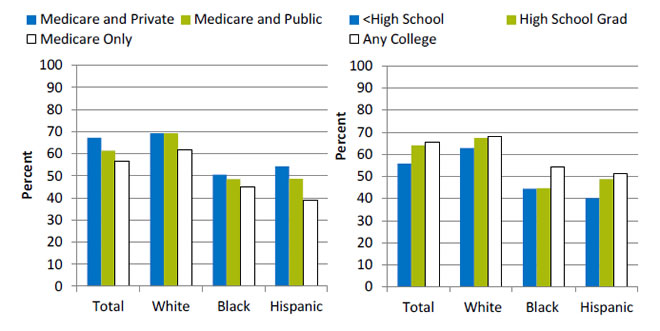
Adults age 65 and over who reported ever receiving pneumococcal immunization, by insurance and education, stratified by race/ethnicity, 2011
Left Chart:
| Insurance | Total | White | Black | Hispanic |
|---|---|---|---|---|
| Medicare and Private | 67.3 | 69.3 | 50.5 | 54.3 |
| Medicare and Public | 61.4 | 69.2 | 48.4 | 48.5 |
| Medicare Only | 56.8 | 61.8 | 44.8 | 38.9 |
Right Chart:
| Education | Total | White | Black | Hispanic |
|---|---|---|---|---|
| <High School | 55.8 | 62.8 | 44.4 | 40.2 |
| High School Grad | 64.1 | 67.3 | 44.7 | 48.7 |
| Any College | 65.5 | 67.9 | 54.4 | 51.2 |
Source: Centers for Disease Control and Prevention, National Center for Health Statistics, National Health Interview Survey, 2011.
Denominator: Adult civilian noninstitutionalized population age 65 and over.
Note: Measure is age adjusted.
- Importance: Immunization is a cost-effective strategy for reducing illness, death, and disparities associated with pneumococcal disease.
- Overall: In 2011, the percentage of adults age 65 years and over who reported ever receiving pneumococcal immunization was 62.7% (data not shown).
- Groups With Disparities:
- In 2011, overall, the percentage of adults who ever received pneumococcal immunization was lower for those with Medicare only and Medicare and public insurance compared with those with Medicare and private insurance.
- In 2011, the percentage of adults who ever received pneumococcal immunization was lower for Hispanic and White adults with Medicare only compared with those with Medicare and private insurance.
- In 2011, overall and for all racial/ethnic groups, the percentage of adults who ever received pneumococcal immunization was lower for adults with less than a high school education compared with those with any college.
Receipt of Pneumococcal Immunization by Hospital Patients
Hospital patients who received pneumococcal immunization, by age, sex, and race/ethnicity, 2012-2013
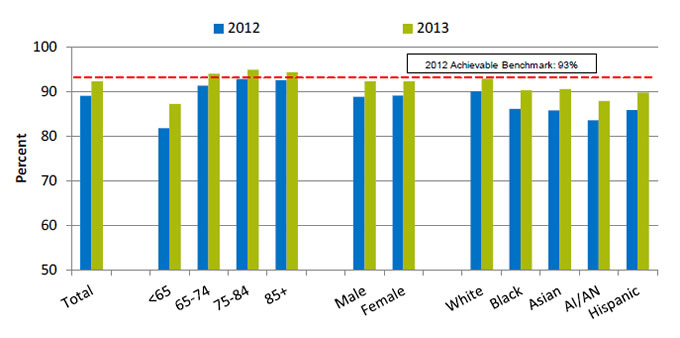
| Characteristics | 2012 | 2013 |
|---|---|---|
| Total | 89 | 92.2 |
| <65 | 81.8 | 87.2 |
| 65-74 | 91.3 | 94.0 |
| 75-84 | 92.8 | 94.9 |
| 85+ | 92.5 | 94.3 |
| Male | 88.8 | 92.2 |
| Female | 89.1 | 92.3 |
| White | 90.0 | 92.8 |
| Black | 86.1 | 90.3 |
| Asian | 85.7 | 90.5 |
| AI/AN | 83.5 | 87.9 |
| Hispanic | 85.8 | 89.8 |
2012 Achievable Benchmark: 93%.
Key: AI/AN = American Indian or Alaska Native.
Source: Centers for Medicare & Medicaid Services, Medicare Quality Improvement Organization Program, 2012-2013.
Denominator: Discharged hospital patients age 65 and over or ages 6-64 with a high-risk condition.
- Importance: Hospitals are important sites for ensuring people receive needed immunizations, including pneumococcal immunization.
- Overall Rate: In 2013, 92.2% of hospital patients received pneumococcal immunization.
- Groups With Disparities:
- In 2012 and 2013, the percentage of hospital patients who received pneumococcal immunization was higher for people ages 65-74, 75-84, and 85+ compared with people less than 65.
- In both years, the percentage of hospital patients who received pneumococcal immunization was lower for Blacks, Asians, American Indians and Alaska Natives, and Hispanics compared with Whites.
- Achievable Benchmark:
- The 2012 top 5 State achievable benchmark was 93%. The top 5 States that contributed to the achievable benchmark are Delaware, Florida, Ohio, South Carolina, and West Virginia.
- In 2013, adults age 65 and over achieved the benchmark. All other groups were below the benchmark.
Receipt of Influenza Immunization by Hospital Patients
Hospital patients who received influenza immunization, by age, sex, and race/ethnicity, 2012-2013
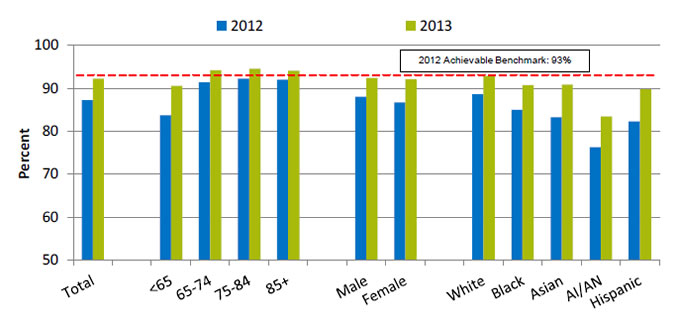
| Characteristics | 2012 | 2013 |
|---|---|---|
| Total | 87.2 | 92.2 |
| <65 | 83.7 | 90.6 |
| 65-74 | 91.4 | 94.1 |
| 75-84 | 92.2 | 94.5 |
| 85+ | 92.0 | 94.1 |
| Male | 88.0 | 92.4 |
| Female | 86.7 | 92.1 |
| White | 88.6 | 92.8 |
| Black | 84.9 | 90.7 |
| Asian | 83.3 | 90.8 |
| AI/AN | 76.3 | 83.4 |
| Hispanic | 82.2 | 89.7 |
2012 Achievable Benchmark: 93%.
Key: AI/AN = American Indian or Alaska Native.
Source: Centers for Medicare & Medicaid Services, Medicare Quality Improvement Organization Program.
Denominator: Hospital patients discharged in October-March.
- Importance: Hospitals are important sites for ensuring people receive needed immunizations, including influenza immunization.
- Overall Rate: in 2013, 92.2% of hospital patients received influenza immunization.
- Groups With Disparities:
- In 2012 and 2013, the percentage of hospital patients who received influenza immunization was higher for people ages 65-74, 75-84, and 85 and over compared with people less than 65.
- In 2012, the percentage of hospital patients who received influenza immunization was lower for females compared with males.
- In both years, the percentage of hospital patients who received influenza immunization was lower for Blacks, Asians, American Indians and Alaska Natives, and Hispanics compared with Whites.
- Achievable Benchmark:
- The 2012 top 5 State achievable benchmark was 93%. The top 5 States that contributed to the achievable benchmark are Delaware, Maryland, New Hampshire, South Carolina, and West Virginia.
- In 2013, adults age 65 and over achieved the benchmark. All other groups were below the benchmark.
Receipt of Pneumococcal Immunization by Nursing Home Residents
Long-stay nursing home residents who were assessed and appropriately given pneumococcal immunization, by age, sex, and race, 2011-2013
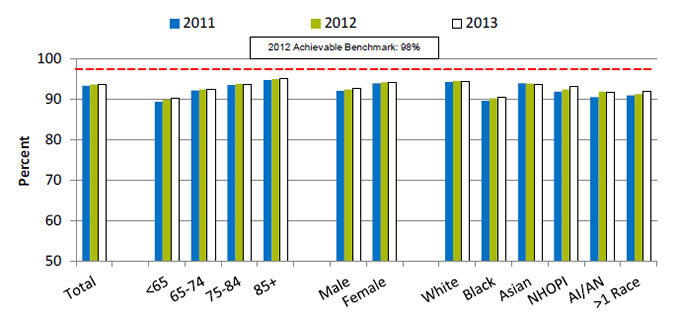
| Characteristics | 2011 | 2012 | 2013 |
|---|---|---|---|
| Total | 93.3 | 93.6 | 93.6 |
| <65 | 89.4 | 89.9 | 90.3 |
| 65-74 | 92.2 | 92.5 | 92.4 |
| 75-84 | 93.5 | 93.8 | 93.7 |
| 85+ | 94.8 | 95.0 | 95.0 |
| Male | 92.1 | 92.5 | 92.6 |
| Female | 93.9 | 94.2 | 94.1 |
| White | 94.3 | 94.5 | 94.5 |
| Black | 89.6 | 90.2 | 90.4 |
| Asian | 93.9 | 93.9 | 93.7 |
| NHOPI | 91.9 | 92.4 | 93.2 |
| AI/AN | 90.5 | 91.9 | 91.8 |
| >1 Race | 91.0 | 91.2 | 91.9 |
2012 Achievable Benchmark: 98%.
Key: NHOPI = Native Hawaiian or Other Pacific Islander; AI/AN = American Indian or Alaska Native.
Source: Centers for Medicare & Medicaid Services, Minimum Data Set, 2011-2013.
Denominator: Long-stay residents in Medicare- or Medicaid-certified nursing home facilities. Long-stay residents typically enter a nursing facility because they can no longer care for themselves at home. They tend to stay in the facility for several months or years.
- Importance: Nursing homes are also important sites for ensuring people receive needed immunizations, including pneumococcal immunization.
- Overall Rate: In 2013, 93.6% of long-stay nursing home residents were assessed and appropriately given pneumococcal immunization.
- Groups With Disparities:
- From 2011 to 2013, the percentage of nursing home residents who were assessed and appropriately given pneumococcal immunization was higher:
- Among residents ages 65-74, 75-84, and 85 and over compared with residents less than 65.
- Among female residents compared with male residents.
- From 2011 to 2013, the percentage of nursing home residents who were assessed and appropriately given pneumococcal immunization was lower:
- Among Blacks, Native Hawaiians and Other Pacific Islanders, American Indians and Alaska Natives, and multiple-race residents compared with Whites.
- From 2012 to 2013, the percentage of nursing home residents who were assessed and appropriately given pneumococcal immunization was lower:
- Among Asians compared with Whites.
- From 2011 to 2013, the percentage of nursing home residents who were assessed and appropriately given pneumococcal immunization was higher:
- Achievable Benchmark:
- The 2012 top 5 State achievable benchmark was 98%. The top 5 States that contributed to the achievable benchmark are Alaska, Delaware, New Hampshire, North Dakota, and Wisconsin.
- All groups were below the benchmark.
Receipt of Influenza Immunization by Nursing Home Residents
Long-stay nursing home residents who were assessed and appropriately given influenza immunization, by age, sex, and race, 2011-2013
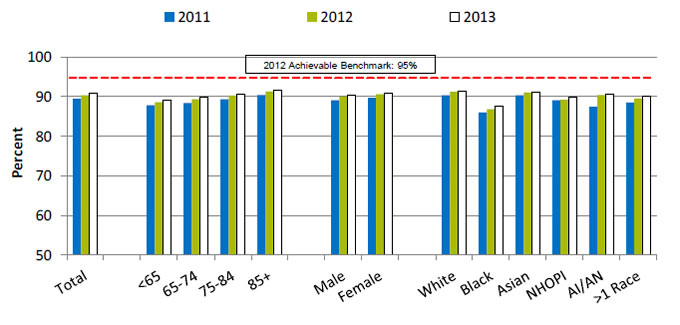
| Characteristics | 2011 | 2012 | 2013 |
|---|---|---|---|
| Total | 89.5 | 90.4 | 90.8 |
| <65 | 87.8 | 88.6 | 89.3 |
| 65-74 | 88.5 | 89.3 | 89.8 |
| 75-84 | 89.4 | 90.3 | 90.7 |
| 85+ | 90.5 | 91.3 | 91.7 |
| Male | 89.1 | 89.9 | 90.5 |
| Female | 89.7 | 90.6 | 91.0 |
| White | 90.4 | 91.2 | 91.5 |
| Black | 86.0 | 86.8 | 87.7 |
| Asian | 90.4 | 91.0 | 91.1 |
| NHOPI | 89.1 | 89.2 | 89.9 |
| AI/AN | 87.5 | 90.4 | 90.7 |
| >1 Race | 88.6 | 89.6 | 90.1 |
2012 Achievable Benchmark: 95%.
Key: NHOPI = Native Hawaiian or Other Pacific Islander; AI/AN = American Indian or Alaska Native.
Source: Centers for Medicare & Medicaid Services, Minimum Data Set, 2011-2013.
Denominator: Long-stay residents in Medicare- or Medicaid-certified nursing home facilities. Long-stay residents typically enter a nursing facility because they can no longer care for themselves at home. They tend to stay in the facility for several months or years.
- Importance: Nursing home residents are at particularly high risk for contracting and developing serious complications of influenza.
- Overall Rate: In 2013, 90.8% of long-stay nursing home residents were assessed and appropriately given influenza immunization.
- Groups With Disparities:
- From 2011 to 2013, the percentage of nursing home residents who were assessed and appropriately given influenza immunization was higher:
- Among residents ages 75-84 and 85 and over compared with residents less than 65.
- From 2011 to 2013, the percentage of nursing home residents who were assessed and appropriately given influenza immunization was lower:
- Among Black and multiple-race residents compared with White residents.
- In 2012 and 2013, the percentage of nursing home residents who were assessed and appropriately given pneumococcal immunization was lower among Native Hawaiians and Other Pacific Islanders compared with Whites.
- From 2011 to 2013, the percentage of nursing home residents who were assessed and appropriately given influenza immunization was higher:
- Achievable Benchmark:
- The 2012 top 5 State achievable benchmark was 95%. The top 5 States that contributed to the achievable benchmark are Hawaii, Iowa, New Hampshire, North Dakota, and South Dakota.
- All groups were below the benchmark.


