Person-Centered Care
- Person-centered care has taken an important place in quality measurement and improvement in the United States and elsewhere.18-21
- Good communication and demonstrations of respect are two critical aspects of person-centered care.22,23
Poor Communication With Health Providers
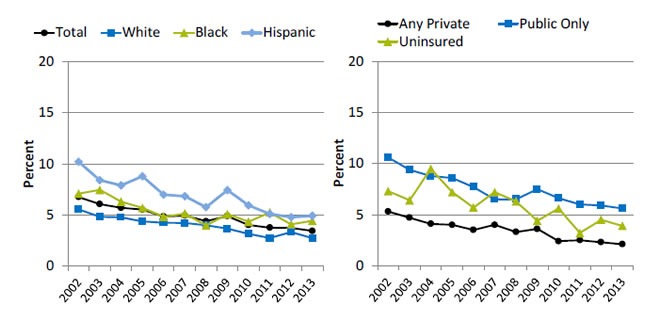
Children who had a doctor’s office or clinic visit in the last 12 months whose parents reported poor communication with health providers, by race/ethnicity and insurance, 2002-2013

Left Chart:
| Race / Ethnicity | 2002 | 2003 | 2004 | 2005 | 2006 | 2007 | 2008 | 2009 | 2010 | 2011 | 2012 | 2013 |
|---|---|---|---|---|---|---|---|---|---|---|---|---|
| Total | 6.7 | 6.1 | 5.7 | 5.5 | 4.8 | 4.9 | 4.4 | 4.9 | 4.0 | 3.8 | 3.7 | 3.4 |
| White | 5.6 | 4.8 | 4.8 | 4.4 | 4.2 | 4.2 | 4.0 | 3.6 | 3.1 | 2.7 | 3.3 | 2.7 |
| Black | 7.1 | 7.5 | 6.3 | 5.7 | 4.8 | 5.1 | 4.0 | 5.1 | 4.3 | 5.2 | 4.1 | 4.4 |
| Hispanic | 10.2 | 8.4 | 7.9 | 8.8 | 7.0 | 6.8 | 5.8 | 7.4 | 5.9 | 5.1 | 4.8 | 4.9 |
Right Chart:
| Year | Any Private | Public Only | Uninsured |
|---|---|---|---|
| 2002 | 5.3 | 10.6 | 7.3 |
| 2003 | 4.7 | 9.4 | 6.4 |
| 2004 | 4.1 | 8.8 | 9.5 |
| 2005 | 4 | 8.6 | 7.2 |
| 2006 | 3.5 | 7.7 | 5.7 |
| 2007 | 4 | 6.5 | 7.2 |
| 2008 | 3.3 | 6.5 | 6.3 |
| 2009 | 3.6 | 7.5 | 4.4 |
| 2010 | 2.4 | 6.6 | 5.6 |
| 2011 | 2.5 | 6 | 3.2 |
| 2012 | 2.3 | 5.9 | 4.5 |
| 2013 | 2.1 | 5.6 | 3.9 |
Source: Agency for Healthcare Research and Quality, Medical Expenditure Panel Survey, 2002-2013.
Note: White and Black are non-Hispanic. Hispanic includes all races. Poor communication is defined as reporting that their health provider sometimes or never listened carefully, explained things clearly, respected what they or their parents had to say, and spent enough time with them. Parents refers to parents or guardians.
- Overall Rate: In 2013, 3.4% of parents reported poor communication with their children’s health provider.
- Trends:
- From 2002 to 2013, the percentage of children whose parents reported poor communication with their health providers decreased from 6.7% to 3.4%.
- Between 2002 and 2013, the percentage of children whose parents reported poor communication decreased for all racial/ethnic and insurance groups.
- Groups With Disparities:
- In 2013, the percentage reporting poor communication with health providers was higher for Hispanic children (4.9%) and Black (4.4%) children compared with White children (2.7%).
- In 2013, 2.1% of parents of privately insured children reported poor communication compared with 5.6% of parents of publicly insured children.
Patient Safety: Birth Trauma
- Cases included in birth trauma measure:
- Hemorrhage below the scalp.
- Cerebral hemorrhage at birth.
- Spinal cord injury at birth.
- Facial nerve injury at birth.
- Bone injury not elsewhere classified at birth.
- Nerve injury not elsewhere classified at birth.
- Birth trauma not elsewhere classified.24
- Many of these injuries to neonates may be preventable.25
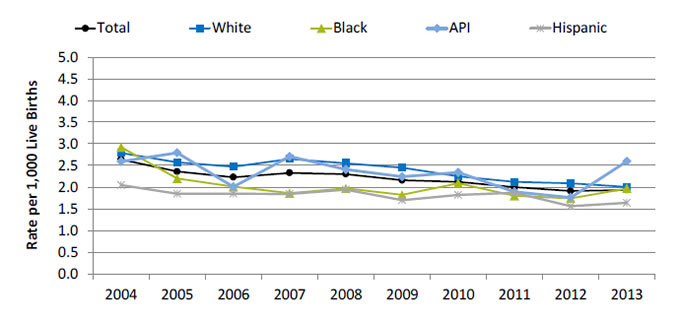
Birth trauma—injury to neonate per 1,000 live births, 2004-2013

| Year | Total | White | Black | API | Hispanic |
|---|---|---|---|---|---|
| 2004 | 2.64 | 2.79 | 2.92 | 2.59 | 2.05 |
| 2005 | 2.36 | 2.57 | 2.20 | 2.79 | 1.85 |
| 2006 | 2.23 | 2.47 | 2.01 | 2.01 | 1.85 |
| 2007 | 2.33 | 2.65 | 1.86 | 2.71 | 1.84 |
| 2008 | 2.30 | 2.55 | 1.97 | 2.41 | 1.94 |
| 2009 | 2.16 | 2.45 | 1.82 | 2.24 | 1.70 |
| 2010 | 2.12 | 2.25 | 2.09 | 2.34 | 1.82 |
| 2011 | 2.00 | 2.12 | 1.80 | 1.89 | 1.87 |
| 2012 | 1.91 | 2.09 | 1.74 | 1.76 | 1.56 |
| 2013 | 1.93 | 2.00 | 1.97 | 2.60 | 1.64 |
Key: API = Asian or Pacific Islander.
Source: Agency for Healthcare Research and Quality (AHRQ), Healthcare Cost and Utilization Project, State Inpatient Databases, disparities analysis file and AHRQ Quality Indicators, modified version 4.4.
Note: White, Black, and API are non-Hispanic. Hispanic includes all races.
- Overall Rate: In 2013, the birth trauma-neonatal injury rate was 1.9 per 1,000 live births.
- Trends:
- Birth trauma-neonatal injury rates fell from 2.6 per 1,000 live births in 2004 to 1.9 per 1,000 live births in 2013.
- Between 2004 and 2013, birth trauma-neonatal injury rates fell for all racial/ethnic groups, except for Asians and Pacific Islanders (APIs).
- Groups With Disparities:
- In 2013, Hispanic neonates (1.6 per 1,000 live births) were less likely to experience birth trauma compared with White neonates (2.0 per 1,000 live births).


