National Healthcare Quality and Disparities Report
Interventions To Maintain and Improve Functional Status
- Some interventions can help prevent diseases that commonly cause declines in functional status:
- Promoting physical activity.
- Promoting social interaction.
- Other interventions can help patients regain lost function or minimize the rate of decline in function:
- Physical therapy.
- Occupational therapy.
- Speech-language therapy.
Settings for Services
- Services are delivered in a variety of settings:
- Hospitals.
- Providers’ offices.
- Patients’ homes.
- Long-term care facilities.
- Other post-acute care or rehabilitation facilities.
Functional Status Preservation and Rehabilitation Measures
- Improvement in mobility among home health care patients.
- Nursing home residents needing more help with daily activities.
Improvement in Mobility Among Home Health Care Patients
- Home care services play an integral role in helping older adults preserve independence, remain in the community, and delay or avoid institutionalization.1
- Home-based physical therapy assists people in restoring strength, balance, and mobility after an illness or injury.2
Improvement in Home Health Care Patients’ Ability To Move or Walk Around
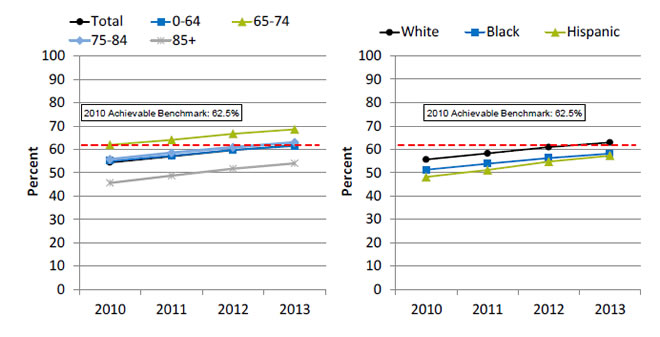
Adult home health patients whose ability to move or walk around improved, by age and race/ethnicity, 2010-2013

Left Chart:
| Age | 2010 | 2011 | 2012 | 2013 |
|---|---|---|---|---|
| Total | 54.4 | 57 | 59.7 | 61.8 |
| 0-64 | 55 | 57.3 | 59.8 | 61.5 |
| 65-74 | 62 | 64.1 | 66.7 | 68.6 |
| 75-84 | 55.7 | 58.5 | 60.9 | 63.0 |
| 85+ | 45.6 | 48.7 | 51.7 | 54.1 |
Right Chart:
| Year | White | Black | Hispanic |
|---|---|---|---|
| 2010 | 55.6 | 51.2 | 48.1 |
| 2011 | 58.2 | 53.8 | 51.1 |
| 2012 | 60.9 | 56.2 | 54.7 |
| 2013 | 62.9 | 58.1 | 57.2 |
2010 Achievable Benchmark: 62.5%.
Source: Centers for Medicare & Medicaid Services, Outcome and Assessment Information Set, 2010-2013.
Note: White and Black are non-Hispanic. Hispanic includes all races.
- Importance: Many patients who receive home health care are recovering from an injury or illness and may have difficulty walking or moving around safely. Maintaining and improving functional status, such as patients’ ability to ambulate, improves quality of life and allows them to stay at home as long as possible. Getting better at walking or moving around may be a sign that their health status is improving.
- Overall Rate: In 2013, 61.8% of home health care patients showed improvement in walking or moving around.
- Trends: From 2010 to 2013, the percentage of home health care patients who showed improvement in walking or moving around increased overall and for all age and racial/ethnic groups.
- Groups With Disparities:
- From 2010 to 2013, home health patients ages 65-74 were more likely than those under age 65 to get better at walking or moving around.
- In all years, home health patients age 85 and over were less likely than those under age 65 to get better at walking or moving around.
- In all years, Hispanic home health patients were less likely than White home health patients to get better at walking or moving around. From 2010 to 2013, there was no statistically significant change in this disparity.
- From 2011 to 2013, Black home health care patients were less likely than White patients to get better at walking or moving around.
- Achievable Benchmark:
- The 2010 top 5 State achievable benchmark was 62.5%. The top 5 States that contributed to the achievable benchmark are Maine, Missouri, New Jersey, South Carolina, and Utah.
- Whites and adults ages 65-74 and 75-84 have achieved the benchmark.
- At current rates, the overall population could reach the benchmark in less than a year. Adults under age 65 could reach the benchmark in less than a year and those age 85 and over would take 4 years.
- Blacks and Hispanics could achieve the benchmark in 3 years.
Nursing Home Residents Needing More Help With Daily Activities
- Independence in activities of daily living (ADLs) is positively associated with quality of life.
- ADLs are basic personal care activities such as dressing, eating, and moving about.
- ADL impairments are strongly associated with poorer physical health, hospital admission, increased cost, and death.
- A resident’s ADL status and likely pattern of change over time are important considerations in determining care priorities.3
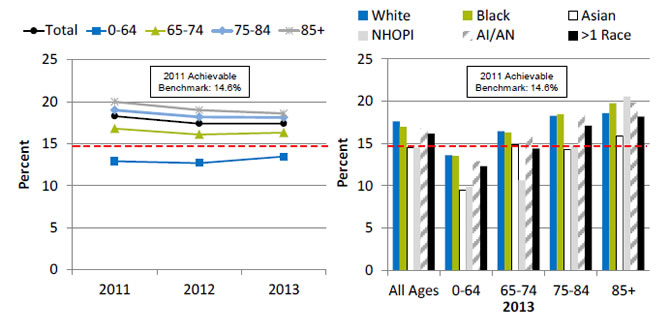
Long-stay nursing home residents whose need for help with daily activities increased, by age, 2011-2013, and by age, stratified by race, 2013

Left Chart:
| Year | Total | 0-64 | 65-74 | 75-84 | 85+ |
|---|---|---|---|---|---|
| 2011 | 18.3 | 12.9 | 16.8 | 19 | 20 |
| 2012 | 17.4 | 12.7 | 16.1 | 18.2 | 19 |
| 2013 | 17.4 | 13.5 | 16.3 | 18.2 | 18.6 |
Right Chart:
| Age | White | Black | Asian | NHOPI | AI/AN | >1 Race |
|---|---|---|---|---|---|---|
| All Ages | 17.64 | 16.96 | 14.52 | 14.52 | 16.84 | 16.17 |
| 0-64 | 13.62 | 13.53 | 9.49 | 9.88 | 12.88 | 12.32 |
| 65-74 | 16.46 | 16.31 | 14.84 | 10.62 | 16.12 | 14.40 |
| 75-84 | 18.27 | 18.47 | 14.24 | 14.66 | 18.60 | 17.11 |
| 85+ | 18.62 | 19.79 | 15.94 | 20.55 | 19.88 | 18.20 |
2011 Achievable Benchmark: 14.6%.
Source: Centers for Medicare & Medicaid, Minimum Data Set, 2011-2013.
Note: For this measure, lower rates are better.
- Importance: Long-stay residents typically enter a nursing facility because they can no longer care for themselves at home. They tend to remain in the facility for several months or years. Most residents want to care for themselves, and the ability to perform daily activities is important to their quality of life. While some functional decline among residents cannot be avoided, high-quality nursing home care should minimize the rate of decline and the number of patients experiencing decline.
- Overall Rate: In 2013, the percentage of long-stay nursing home residents who had increased need for help with daily activities was 17.4%.
- Groups With Disparities:
- From 2011 to 2013, nursing home residents ages 0-64 were less likely than residents in other age groups to need increased help with daily activities.
- In age groups 0-64, 75-84, and 85 and over, Asian residents were less likely than White residents to need increased help with daily activities.
- Achievable Benchmark:
- The 2011 top 5 State achievable benchmark was 14.6%. The top 5 States that contributed to the achievable benchmark are Alaska, California, Illinois, Oregon, and, Utah.
- Residents ages 0-64 had a rate below the benchmark. Residents of all races ages 0-64 had a rate below the benchmark.
- Data are insufficient to determine time to benchmark for other groups.
References
- Lo AT, Gruneir A, Bronskill SE, et al. Sex differences in home care performance: a population-based study. Womens Health Issues 2015 May-Jun;25(3):232-8. Epub 2015 Apr 15. PMID: 25890502. http://www.sciencedirect.com/science/article/pii/S1049386715000055. Accessed March 24, 2016.
- Russell D, Rosati RJ, Andreopoulos E. Continuity in the provider of home-based physical therapy services and its implications for outcomes of patients. Phys Ther 2012 Feb;92(2):227-35. Epub 2011 Nov 10. PMID: 22074941. https://doi.org/10.2522/ptj.20110171. Accessed March 24, 2016.
- Kruse RL, Petroski GF, Mehr DR, et al. Activity of daily living trajectories surrounding acute hospitalization of long-stay nursing home residents. J Am Geriatr Soc Nov;61(11):1909-18. Epub 2013 Oct 28. PMID: 24219192. http://www.ncbi.nlm.nih.gov/pmc/articles/PMC3831170/. Accessed March 24, 2016.


