National Healthcare Quality and Disparities Report
Maternal and Child Health Care Measures
- Access:
- Periods of uninsurance.
- Effectiveness:
- Prenatal care.
- Receipt of recommended immunizations by young children.
- Children's vision screening.
- Well-child visits in the last year.
- Receipt of meningococcal vaccine by adolescents.
- Receipt of human papillomavirus (HPV) vaccination by adolescents.
- Person-Centered Care:
- Children who had a doctor’s office or clinic visit in the last 12 months who reported poor communication with health providers.
- Patient Safety:
- Birth trauma—injury to neonates.
- Care Coordination:
- Children and adolescents whose health provider usually asks about prescription medications and treatments from other doctors.
- Emergency department (ED) visits with a principal diagnosis related to mental health, alcohol, or substance abuse.
- ED visits for asthma.
Access: Children and Adolescents With Periods of Uninsurance
- Coverage gaps ("uninsurance") are a significant factor in children's access to and use of care, as well as their health outcomes.1-3
- Resources through the Children’s Health Insurance Program Reauthorization Act (CHIPRA) are designed to increase Medicaid/CHIP enrollment:
- Outreach programs.
- Simplified enrollment strategies.4
- Coverage gaps are still found for as many as 40% of new CHIP enrollees5 despite changes in State enrollment, renewal, and outreach processes.
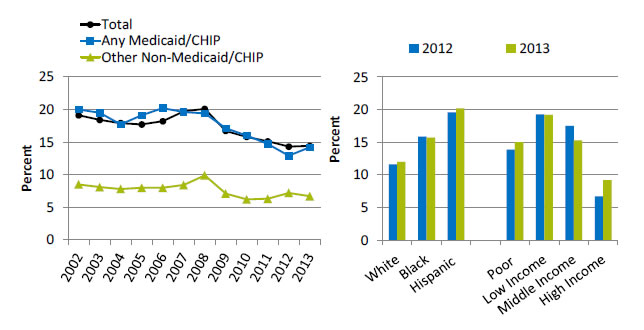
Children and adolescents ages 0-17 years with any period of uninsurance during the year, by insurance, 2002-2013, and by race/ethnicity and income, 2012-2013

Left Chart:
| Year | Total | Other Non-Medicaid/CHIP | Any Medicaid/CHIP |
|---|---|---|---|
| 2002 | 19.1 | 8.5 | 20 |
| 2003 | 18.4 | 8.1 | 19.5 |
| 2004 | 17.9 | 7.8 | 17.7 |
| 2005 | 17.7 | 8 | 19.1 |
| 2006 | 18.2 | 8 | 20.2 |
| 2007 | 19.7 | 8.4 | 19.6 |
| 2008 | 20.1 | 9.9 | 19.4 |
| 2009 | 16.7 | 7.1 | 17.1 |
| 2010 | 15.8 | 6.2 | 16 |
| 2011 | 15.1 | 6.3 | 14.7 |
| 2012 | 14.3 | 7.2 | 12.9 |
| 2013 | 14.4 | 6.7 | 14.2 |
Right Chart:
| Characteristics | 2012 | 2013 |
|---|---|---|
| White | 11.6 | 12 |
| Black | 15.9 | 15.7 |
| Hispanic | 19.6 | 20.2 |
| Poor | 13.9 | 15 |
| Low Income | 19.3 | 19.2 |
| Middle Income | 17.5 | 15.3 |
| High Income | 6.7 | 9.2 |
Key: CHIP = Children's Health Insurance Program.
Source: Agency for Healthcare Research and Quality, Medical Expenditure Panel Survey, 2002-2013.
Note: White and Black are non-Hispanic. Hispanic includes all races.
- Overall: In 2013, the percentage of children and adolescents ages 0-17 with any period of uninsurance during the year was 14.4%.
- Trends:
- The overall percentage of children and adolescents ages 0-17 years with any period of uninsurance during the year declined from 19.1% in 2002 to 14.4% in 2013.
- Among children and adolescents with any Medicaid or CHIP insurance, the percentage with any period of uninsurance during the year declined from 20.0% in 2002 to 14.2% in 2013.
- Groups With Disparities:
- In 2012 and 2013, White children were less likely to have a period of uninsurance than Black and Hispanic children.
- In 2012 and 2013, children in families with high incomes were less likely than children in every other income category to have a period of uninsurance.


