Monitoring Ventilator-Associated Events: Slide Presentation
AHRQ Safety Program for Mechanically Ventilated Patients
Slide 1: AHRQ Safety Program for Mechanically Ventilated Patients
Monitoring Ventilator-Associated Events
Slide 2: Learning Objectives
After this session, you will be able to—
- Describe the impact of mechanical ventilation and ventilator-associated events (VAE).
- Identify the definitions of VAE.
- Recognize the need for an accurate objective outcome measure for VAE.
- Correctly apply VAE diagnostic criteria to determine if a VAE has occurred.
Slide 3: Impact of Mechanical Ventilation
- Affects 800,000 hospitalized patients in the United States each year.1
- Five to 10 percent of ventilated patients develop a VAE.2,3
1. Carson SS, Cox CE, Homes GM, et al. The changing epidemiology of mechanical ventilation: a population-based study. J Intensive Care Med 2006; 21(3):173-82. PMID: 16672639.
2. Klompas M, Kleinman K, Murphy MV. Descriptive epidemiology and attributable morbidity of ventilator-associated events. Infect Control Hosp Epidemiol 2014; 35(5):502-510. PMID: 24709718.
3. Klein Klouwenberg PM, van Mourik, Ong DS, et al: Electronic implementation of a novel surveillance paradigm for ventilator-associated events: feasibility and validation. Am J Respir Crit Care Med 2014 Apr 15;189(8):947-55. PMID: 24498886.
Slide 4: Impact of Mechanical Ventilation

- Historically, ventilator-associated pneumonia (VAP) was considered one of the most lethal healthcare-associated infections.4
- 35% mortality rate for ventilated patients.5
- 24% for patients 15–19 years.
- 60% for patients 85 years and older.
4. Safdar N, Dezfullian C, Collard HR, et al. Clinical and economic consequences of ventilator–associated pneumonia: a systematic review. Crit Care Med 2005; 33(10):2184-93. PMID: 16215368.
5. Wunsch H, Linde-Zwirble WT, Angus DC, et al. The epidemiology of mechanical ventilation use in the United States. Crit Care Med 2010; 38(10):1947-53. PMID: 20639743.
Slide 5: Possible Complications of Mechanical Ventilation

- VAE:
- Ventilator-associated condition (VAC).
- Infection-related ventilator-associated condition (IVAC).
- VAP.
- Acute Respiratory Distress Syndrome (ARDS).
- Sepsis.
- Pulmonary embolism.
- Pulmonary edema.
- Barotrauma.
- And more.
Image: Arrow pointing to the left to indicate VAE items on the list.
Slide 6: Understanding the Impact of VAC
Impact of Ventilator-Associated Conditions:
- VAC is typically attributable to pneumonia, pulmonary edema, atelectasis, or Acute Respiratory Distress Syndrome (ARDS).2
- VAC has a strong association with prolonged mechanical ventilation, length of stay, and mortality.6
2. Klompas M, Kleinman K, Murphy MV. Descriptive epidemiology and attributable morbidity of ventilator-associated events. Infect Control Hosp Epidemiol 2014; 35(5):502-510. PMID: 24709718.
6. Hayashi Y, Morisawa K, Klompas M, et al. Toward improved surveillance: the impact of ventilator-associated complications on length of stay and antibiotic use in patients in intensive care units. Clin Infect Dis 2013; 56(4):471-7. PMID: 23118272.
Slide 7: Understanding the Impact of VAC
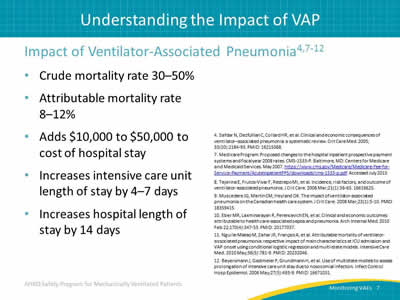
Impact of Ventilator-Associated Pneumonia:4,7-12
- Crude mortality rate 30–50%.
- Attributable mortality rate 8–12%.
- Adds $10,000 to $50,000 to cost of hospital stay.
- Increases intensive care unit length of stay by 4–7 days.
- Increases hospital length of stay by 14 days.
4. Safdar N, Dezfullian C, Collard HR, et al. Clinical and economic consequences of ventilator–associated pneumonia: a systematic review. Crit Care Med 2005; 33(10):2184-93. PMID: 16215368.
7. Medicare Program: Proposed changes to the hospital inpatient prospective payment systems and fiscal year 2008 rates. CMS-1533-P. Baltimore, MD: Centers for Medicare and Medicaid Services. May 2007. https://www.cms.gov/Medicare/Medicare-Fee-for-Service-Payment/AcuteInpatientPPS/downloads/cms-1533-p.pdf. Accessed July 2015.
8. Tejerina E, Frutos-Vivar F, Restrepo MI, et al. Incidence, risk factors, and outcome of ventilator-associated pneumonia. J Crit Care 2006 Mar;21(1):56-65. 16616625.
9. Muscedere JG, Martin CM, Heyland DK. The impact of ventilator-associated pneumonia on the Canadian health care system. J Crit Care 2008 Mar;23(1):5-10. PMID: 18359415.
10. Eber MR, Laxminarayan R, Perencevich EN, et al. Clinical and economic outcomes attributable to health care-associated sepsis and pneumonia. Arch Internal Med 2010 Feb 22;170(4):347-53. PMID: 20177037.
11. Nguile-Makao M, Zahar JR, Français A, et al. Attributable mortality of ventilator-associated pneumonia: respective impact of main characteristics at ICU admission and VAP onset using conditional logistic regression and multi-state models. Intensive Care Med 2010 May;36(5):781-9. PMID: 20232046.
12. Beyersmann J, Gastmeier P, Grundmann H, et al. Use of multistate models to assess prolongation of intensive care unit stay due to nosocomial infection. Infect Control Hosp Epidemiol 2006 May;27(5):493-9. PMID: 16671031.
Slide 8: Why Is This Work Important?

VAE Attributable Hospital Mortality2
Image: Table showing VAE attributable hospital mortality over all VAE tiers vs. no VAEs.
2. Klompas M, Kleinman K, Murphy MV. Descriptive epidemiology and attributable morbidity of ventilator-associated events. Infect Control Hosp Epidemiol 2014; 35(5):502-510. PMID: 24709718.
Slide 9: National Health Safety Network VAE Definition

- Objective.
- Streamlined.
- Potentially automatable.
- Defines a broad range of conditions and complications occurring in mechanically ventilated patients.
Slide 10: What Types of Mechanical Ventilation Are Included?

- All types of mechanical ventilation, except—
- High-frequency ventilation.
- Extracorporeal membrane oxygenation.
- Lung expansion devices, such as—
- Intermittent positive pressure breathing.
- Nasal positive end-expiratory pressure (PEEP).
- Nasal continuous positive airway pressure.
- Airway pressure release ventilation (APRV) and related modes are included but only fraction of inspired oxygen (FiO2) values are used.
Slide 11: VAE Definition Tiers13
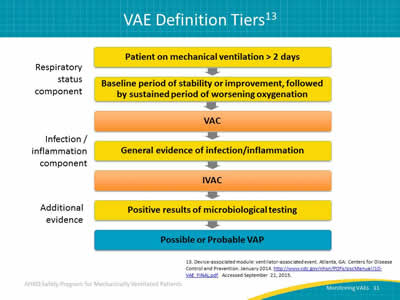
Image: Visual flowchart representation of VAE definition tiers.
13. Device-associated module: ventilator-associated event. Atlanta, GA: Centers for Disease Control and Prevention. January 2014. http://www.cdc.gov/nhsn/PDFs/pscManual/10-VAE_FINAL.pdf. Accessed September 21, 2015.
Slide 12: VAC—Definition Criteria
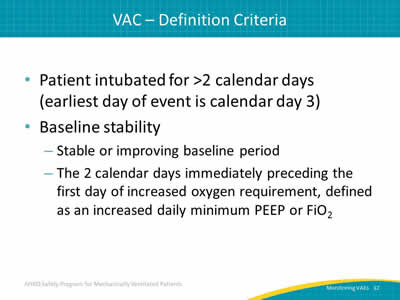
- Patient intubated for >2 calendar days (earliest day of event is calendar day 3).
- Baseline stability:
- Stable or improving baseline period.
- The 2 calendar days immediately preceding the first day of increased oxygen requirement, defined as an increased daily minimum PEEP or FiO2.
Slide 13: VAC—Determination

After period of stability or improvement on the ventilator, the patient exhibits at least one of these indicators of worsening oxygenation:
- Daily minimum PEEP values increase ≥ 3 cm H2O over daily minimum for the preceding 2 calendar days.
- Daily minimum FiO2 values increase ≥ 0.20 over daily minimum for preceding 2 calendar days.
- PEEP or FiO2 must be maintained for ≥ 1 hour (two consecutive hour readings) (see next slide for exceptions to this rule).
Slide 14: VAC—Exceptions to One-Hour Rule

- If PEEP or FiO2 values are not recorded hourly, use lowest value.
- If PEEP or FiO2 values are not stable for at least 1 hour, use the lowest value:
- Patient extubated early in the day.
- Patient admitted late in the day.
Slide 15: IVAC—Criterion 1
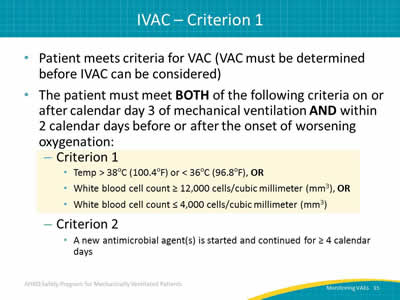
- Patient meets criteria for VAC (VAC must be determined before IVAC can be considered).
- The patient must meet BOTH of the following criteria on or after calendar day 3 of mechanical ventilation AND within 2 calendar days before or after the onset of worsening oxygenation:
- Criterion 1:
- Temp > 38oC (100.4oF) or < 36oC (96.8oF), OR
- White blood cell count ≥ 12,000 cells/cubic millimeter (mm3), OR
- White blood cell count ≤ 4,000 cells/cubic millimeter (mm3).
- Criterion 2:
- A new antimicrobial agent(s) is started and continued for ≥ 4 calendar days.
- Criterion 1:
Slide 16: IVAC—Criterion 2

- Patient meets criteria for VAC (VAC must be determined before IVAC can be considered).
- The patient must meet BOTH of the following criteria on or after calendar day 3 of mechanical ventilation AND within 2 calendar days before or after the onset of worsening oxygenation:
- Criterion 1:
- Temp > 38oC (100.4oF) or < 36oC (96.8oF), OR
- White blood cell count ≥ 12,000 cells/cubic millimeter (mm3), OR
- White blood cell count ≤ 4,000 cells/cubic millimeter (mm3).
- Criterion 2:
- A new antimicrobial agent(s) is started and continued for ≥ 4 calendar days.
- Criterion 1:
Slide 17: IVAC Antimicrobial Criteria

Standardizes assessment method of antimicrobial therapy without the need for specific information, such as—
- Drug dosing.
- Renal function.
- Indication for therapy.
Slide 18: IVAC—Antimicrobials Included

Current:
- Antibacterials.
- Antifungals, limited antivirals.
Former:
- Broad range of agents for healthcare-associated infections, not just respiratory infections.
Listed in the CDC’s VAE Manual: http://www.cdc.gov/nhsn/PDFs/pscManual/10-VAE_FINAL.pdf
Slide 19: IVAC—Antimicrobials NOT Included
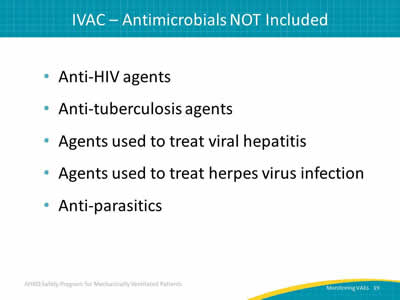
- Anti-HIV agents.
- Anti-tuberculosis agents.
- Agents used to treat viral hepatitis.
- Agents used to treat herpes virus infection.
- Anti-parasitics.
Slide 20: Definition—New Antimicrobial Agent
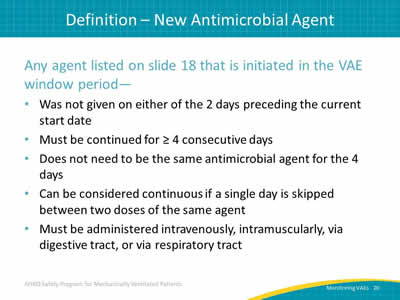
Any agent listed on slide 18 that is initiated in the VAE window period—
- Was not given on either of the 2 days preceding the current start date.
- Must be continued for ≥ 4 consecutive days.
- Does not need to be the same antimicrobial agent for the 4 days.
- Can be considered continuous if a single day is skipped between two doses of the same agent.
- Must be administered intravenously, intramuscularly, via digestive tract, or via respiratory tract.
Slide 21: IVAC—New Antimicrobials NOT Included
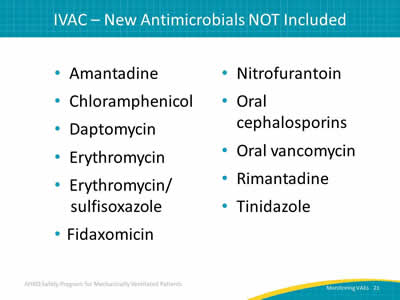
- Amantadine.
- Chloramphenicol.
- Daptomycin.
- Erythromycin.
- Erythromycin/sulfisoxazole.
- Fidaxomicin.
- Nitrofurantoin.
- Oral cephalosporins.
- Oral vancomycin.
- Rimantadine.
- Tinidazole.
Slide 22: AHRQ Safety Program for Mechanically Ventilated Patients

VAE: An Objective Outcome Measure
Slide 23: Diagnostic Criteria for VAP14
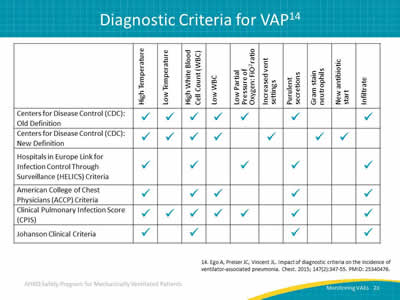
Image: Table outlining six definitions for ventilator-associated pneumonia.
14. Ego A, Preiser JC, Vincent JL. Impact of diagnostic criteria on the incidence of ventilator-associated pneumonia. Chest 2015; 147(2):347-55. PMID: 25340476.
Slide 24: Impact of Diagnostic Criteria on VAP Prevalence14

Image: Bar graph illustrating the differing number of VAPs based on the six different VAP definitions.
14. Ego A, Preiser JC, Vincent JL. Impact of diagnostic criteria on the incidence of ventilator-associated pneumonia. Chest 2015; 147(2):347-55. PMID: 25340476.
Slide 25: Inconsistency in VAP Diagnoses15

Image: Highlights of a French study showing that only a minority of patients who appeared to have VAP actually had VAP.
- 84 ICU patients with abnormal chest x rays and purulent sputum.
- Evaluated by seven physicians for VAP.
- Establish objective diagnosis by histology or quantitative bronchoscopy cultures.
- 32% of patients diagnosed with VAP.
15. Fagon JY, Chastre J, Hance AJ, et al. Evaluation of clinical judgment in the identification and treatment of nosocomial pneumonia in ventilated patients. Chest 1993; 103(2):547-53. PMID: 8432152.
Slide 26: Inconsistency in VAP Diagnoses15
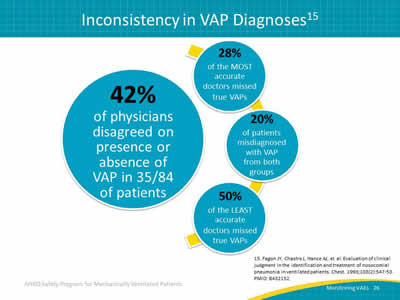
Image: The clinical diagnosis for VAP is simply poor, that as much as we think we might be able to tell who does and does not have pneumonia, the evaluation studies do not support that belief.
- 42% of physicians disagreed on presence or absence of VAP in 35/84 of patients.
- 28% of the MOST accurate doctors missed true VAPs.
- 20% of patients misdiagnosed with VAP from both groups.
- 50% of the LEAST accurate doctors missed true VAPs.
15. Fagon JY, Chastre J, Hance AJ, et al. Evaluation of clinical judgment in the identification and treatment of nosocomial pneumonia in ventilated patients. Chest 1993; 103(2):547-53. PMID: 8432152.
Slide 27: AHRQ Safety Program for Mechanically Ventilated Patients

Diagnosing A Potential VAC
Slide 28: Let’s Find a VAC

- Daily minimum PEEP values increase ≥ 3 cm water over daily minimum for the preceding 2 calendar days.
- Daily minimum FiO2 values increase ≥ 0.20 over daily minimum for preceding 2 calendar days.
Slide 29: Example 1—PEEP

The change is maintained or worsens for ≥ 2 days.
Is this a VAC?
Image: A table showing mechanically ventilated days, minimum PEEP value, and minimum FiO2 over 10 days.
Slide 30: Example 1—PEEP

Two days of stable PEEP, followed by a change in PEEP of ≥ 3.
The change is maintained or worsens for ≥ 2 days.
Is this a VAC?
YES!
This is a VAC!
Image: A table showing mechanically ventilated days, minimum PEEP value, and minimum FiO2 over 10 days.
Slide 31: Example 2—FiO2
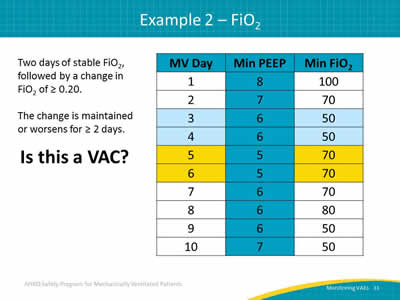
Two days of stable FiO2, followed by a change in FiO2 of ≥ 0.20.
The change is maintained or worsens for ≥ 2 days.
Is this a VAC?
Image: A table showing mechanically ventilated days, minimum PEEP value, and minimum FiO2 over ten days.
Slide 32: Example 2__FiO2
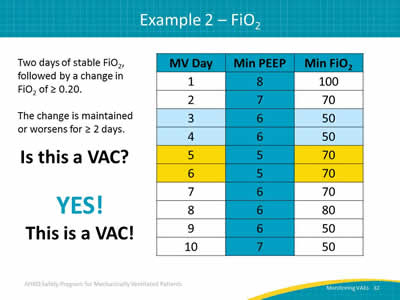
Two days of stable FiO2, followed by a change in FiO2 of ≥ 0.20.
The change is maintained or worsens for ≥ 2 days.
Is this a VAC?
YES!
This is a VAC!
Image: A table showing mechanically ventilated days, minimum PEEP value, and minimum FiO2 over ten days.
Slide 33: Example 3

Examine the PEEP and FiO2 values…
Is this a VAC?
Image: A table showing mechanically ventilated days, minimum PEEP value, and minimum FiO2 over ten days.
Slide 34: Example 3
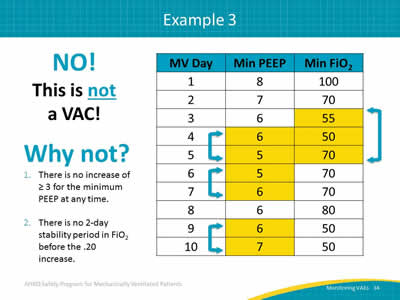
NO!
This is not a VAC!
Why not?
- There is no increase of ≥ 3 for the minimum PEEP at any time.
- There is no 2-day stability period in FiO2 before the .20 increase.
Image: A table showing mechanically ventilated days, minimum PEEP value, and minimum FiO2 over ten days.
Slide 35: Questions?

Image: Hanging colored tags with question marks on them.
Slide 36: References
1. Carson SS, Cox CE, Homes GM, et al. The changing epidemiology of mechanical ventilation: a population-based study. J Intensive Care Med 2006; 21(3):173-82. PMID: 16672639.
2. Klompas M, Kleinman K, Murphy MV. Descriptive epidemiology and attributable morbidity of ventilator-associated events. Infect Control Hosp Epidemiol 2014; 35(5):502-510. PMID: 24709718.
3. Klein Klouwenberg PM, van Mourik, Ong DS, et al: Electronic implementation of a novel surveillance paradigm for ventilator-associated events: feasibility and validation. Am J Respir Crit Care Med 2014 Apr 15;189(8):947-55. PMID: 24498886.
4. Safdar N, Dezfullian C, Collard HR, et al. Clinical and economic consequences of ventilator–associated pneumonia: a systematic review. Crit Care Med 2005; 33(10):2184-93. PMID: 16215368.
Slide 37: References

5. Wunsch H, Linde-Zwirble WT, Angus DC, et al. The epidemiology of mechanical ventilation use in the United States. Crit Care Med 2010; 38(10):1947-53. PMID: 20639743.
6. Hayashi Y, Morisawa K, Klompas M, et al. Toward improved surveillance: the impact of ventilator-associated complications on length of stay and antibiotic use in patients in intensive care units. Clin Infect Dis 2013; 56(4):471-7. PMID: 23118272.
7. Medicare Program: Proposed changes to the hospital inpatient prospective payment systems and fiscal year 2008 rates. CMS-1533-P. Baltimore, MD: Centers for Medicare and Medicaid Services. May 2007. https://www.cms.gov/Medicare/Medicare-Fee-for-Service-Payment/AcuteInpatientPPS/downloads/cms-1533-p.pdf. Accessed July 2015.
Slide 38: References
8. Tejerina E, Frutos-Vivar F, Restrepo MI, et al. Incidence, risk factors, and outcome of ventilator-associated pneumonia. J Crit Care 2006 Mar;21(1):56-65. 16616625.
9. Muscedere JG, Martin CM, Heyland DK. The impact of ventilator-associated pneumonia on the Canadian health care system. J Crit Care 2008 Mar;23(1):5-10. PMID: 18359415.
10. Eber MR, Laxminarayan R, Perencevich EN, et al. Clinical and economic outcomes attributable to health care-associated sepsis and pneumonia. Arch Internal Med 2010 Feb 22;170(4):347-53. PMID: 20177037.
11. Nguile-Makao M, Zahar JR, Français A, et al. Attributable mortality of ventilator-associated pneumonia: respective impact of main characteristics at ICU admission and VAP onset using conditional logistic regression and multi-state models. Intensive Care Med 2010 May;36(5):781-9. PMID: 20232046.
Slide 39: References

12. Beyersmann J, Gastmeier P, Grundmann H, et al. Use of multistate models to assess prolongation of intensive care unit stay due to nosocomial infection. Infect Control Hosp Epidemiol 2006 May;27(5):493-9. PMID: 16671031.
13. Device-associated module: ventilator-associated event. Atlanta, GA: Centers for Disease Control and Prevention. January 2014. http://www.cdc.gov/nhsn/PDFs/pscManual/10-VAE_FINAL.pdf. Accessed September 21, 2015.
14. Ego A, Preiser JC, Vincent JL. Impact of diagnostic criteria on the incidence of ventilator-associated pneumonia. Chest 2015; 147(2):347-55. PMID: 25340476.
15. Fagon JY, Chastre J, Hance AJ, et al. Evaluation of clinical judgment in the identification and treatment of nosocomial pneumonia in ventilated patients. Chest 1993; 103(2):547-53. PMID: 8432152.


