National Healthcare Quality and Disparities Report
This chartbook is part of a family of documents and tools that support the National Healthcare Quality and Disparities Reports (QDR). The QDR includes annual reports to Congress mandated in the Healthcare Research and Quality Act of 1999 (P.L. 106-129). These reports provide a comprehensive overview of the quality of health care received by the general U.S. population and disparities in care experienced by different racial, ethnic, and socioeconomic groups. The purpose of the reports is to assess the performance of our health system and to identify areas of strengths and weaknesses in the health care system along three main axes: access to health care, quality of health care, and priorities of the National Quality Strategy.
The reports are based on more than 250 measures of quality and disparities covering a broad array of health care services and settings. Data are from the 2015 QDR, generally reflecting collection through 2014. The reports are produced with the help of an Interagency Work Group led by the Agency for Healthcare Research and Quality (AHRQ) and submitted on behalf of the Secretary of Health and Human Services (HHS).
Chartbook on Health Care for Blacks
- This chartbook includes summaries of trends in health care for Black populations related to:
- Priorities of the Heckler Report.
- Access to health care.
- Priorities of the National Quality Strategy.
- QDR Introduction and Methods contains information about methods used in the chartbook.
- A Data Query tool provides access to all data tables.
Key Metrics Used in Chartbooks
- Trends: Assesses the rate of change over time (typically 2002-2013) for a population.
- Disparities: Assesses whether measure estimates for two populations differ at the most recent time point.
- Change in Disparities: Assesses whether the rates of change over time for two populations differ.
- Achievable Benchmarks: Defines a level of performance for a measure that has been attained by the best performing States (top 10 percent).
In this chartbook Blacks are usually contrasted with Whites. To make text more concise, the labels White and Black are used to refer to populations that are non-Hispanic Black and non-Hispanic White, respectively. In addition, unless otherwise specified, Hispanics include all races.
Examples of successful interventions come from the AHRQ Health Care Innovations Exchange. Go to Introduction and Methods for more information about methods used in the chartbook.
HHS Data Collection Standards for Race and Ethnicity, 2011
Are you of Hispanic, Latino/a, or Spanish origin? (One or more categories may be marked)
These categories roll up to the Hispanic or Latino category of the Office of Management and Budget (OMB) standard. What is your race? (One or more categories* may be selected)
These categories are part of the current OMB standard.
These categories roll up to the Asian category of the OMB standard.
These categories roll up to the Native Hawaiian or Other Pacific Islander category of the OMB standard. |
- The Affordable Care Act includes several provisions aimed at eliminating health disparities in America. Section 4302 (Understanding health disparities: data collection and analysis) focuses on the standardization, collection, analysis, and reporting of health disparities data. Section 4302 requires the Secretary of Health and Human Services (HHS) to establish data collection standards for race, ethnicity, sex, primary language, and disability status. Adopted October 31, 2011, these data collection standards are to be used, to the extent practicable, in HHS-sponsored population health surveys.
- The new data standards improve the quality of HHS data collection by building on the Office of Management and Budget (OMB) minimum standard, including additional specificity as well as categories that can be consolidated to the current OMB standard. For many large HHS surveys, including the National Health Interview Survey, National Survey on Drug Use and Health, and Medical Expenditure Panel Survey, slight differences in subcategories limited the ability to compare racial and ethnic groups between surveys; the new standards create uniform categories to facilitate these comparisons (Dorsey, et al., 2014).
Source: Sorsey R, Graham G, Glied S, et al. Implementing health reform: improved data collection and the monitoring of health disparities. Annu Rev Public Health 2014;35:123-38.
Diversity of the U.S. Population
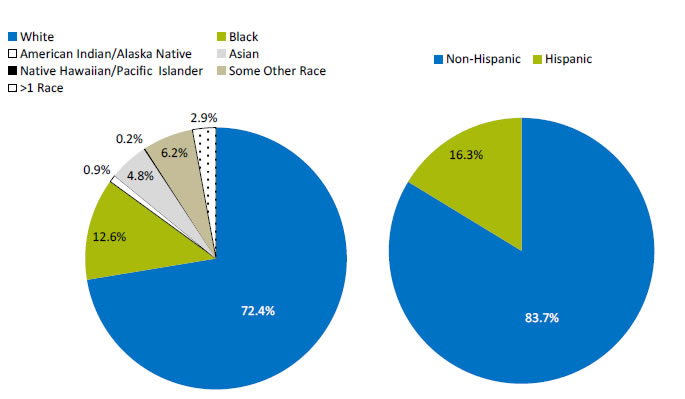
Racial and Ethnic Makeup of the U.S. Population, 2010
Source: Humes KR, Jones NA, Ramirez RR. Overview of race and Hispanic origin: 2010. 2010 Census Briefs. Suitland, MD: U.S. Census Bureau; March 2011. Publication No. C2010BR-02. http://www.census.gov/prod/cen2010/briefs/c2010br-02.pdf (5.4 MB).
- According to the 2010 Census, Whites made up 72% of the population of the United States in comparison to 83% in 1980 (refer to 1980 Census at http://www2.census.gov/prod2/decennial/documents/1980/1980censusofpopu8011u_bw.pdf [21.24 MB]) and 88% at the beginning of the 20th century (refer to 1910 Census, available at http://www.census.gov/prod/www/decennial.html).
- In 1980, minorities made up about 20% of the population in the United States, African Americans being the largest minority group at 11.7%. In 2010, Hispanics were the largest minority group, making up more than 16% of the total population, and African Americans just under 13%.
Diversity of the Black Population in the United States
15 Largest Ancestries, United States, 2000
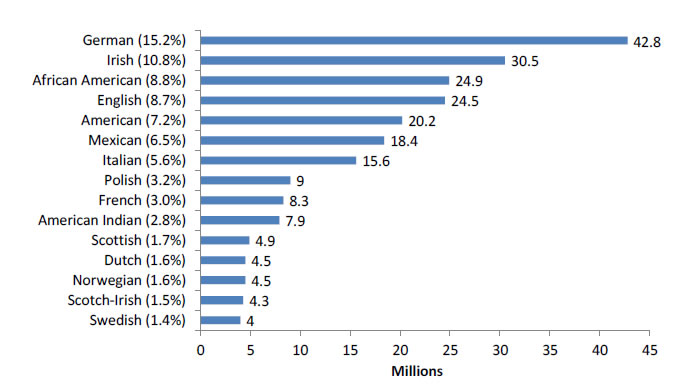
Note: Data based on sample. For information on confidentiality protection, sampling error, nonsampling error, and definitions, go to www.census.gov/prod/cen2000/doc/sf3.pdf (5.67 MB).
- Blacks in the United States are a diverse population and in 2013 included:
- Total population (39.9 million).
- Percent of the total population (12.6%).
- U.S.-born Blacks (36.2 million).
- Foreign-born Blacks (3.8 million):
- Jamaican (682,000).
- Haitian (586,000).
- Nigerian (226,000).
- Dominican (166,000).
- Other foreign-born Blacks include people from Ghana (147,000), Guyana (122,000), Kenya (107,000), Liberia (83,000), Somalia (79,000), Mexico (70,000), Barbados (51,000), Cameroon (48,000), Cuba (41,000), Sierra Leone (36,000), Grenada (34,000), Eritrea (33,000), Panama (32,000), Belize (32,000), Sudan (30,000), Bahamas (27,000), and England (22,000).
- Foreign-born Blacks include single-race blacks and multiple-race Blacks, regardless of Hispanic origin.
- Foreign-born Black populations do not add up to the total foreign-born Black population because regions with fewer Black immigrants, such as Asia, the Middle East, and most of Europe were not included.
- Hispanic Blacks (3.2 million).
Source: U.S. Census Bureau. American FactFinder. http://factfinder.census.gov/faces/tableservices/jsf/pages/productview.xhtml?pid=ACS_13_1YR_B05003B&prodType=table and Anderson M. A rising share of the U.S. black population is foreign born. Washington, DC: Pew Research Center; April 2015. http://www.pewsocialtrends.org/2015/04/09/a-rising-share-of-the-u-s-black-population-is-foreign-born.
Distribution of the U.S. Black Population
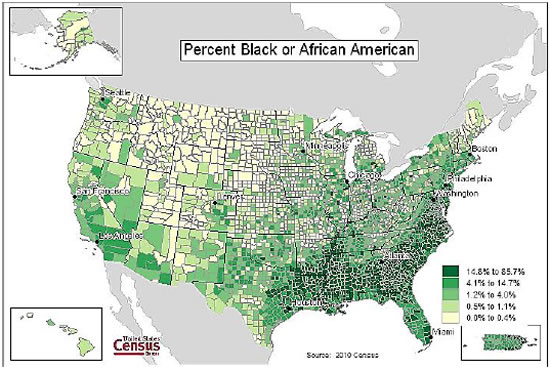
Distribution of the U.S. Black Population, 2010
Source: U.S. Census Bureau. 2010 Census Summary File 1. Map generated from the Census Data Mapper at https://www.census.gov/library/video/2017/census-flows-mapper.html.
Note: For information on confidentiality protection, nonsampling error, and definitions, go to www.census.gov/prod/cen2010/doc/sf1.pdf (7.38 MB).
- Blacks are the second largest minority population, following the Hispanic/Latino population. In 2010, most Blacks lived in the South (55% of the U.S. Black population), while 36% of the White population lived in the South.
- The 10 States with the largest Black population are Florida, Texas, New York, Georgia, California, North Carolina, Illinois, Maryland, Virginia, and Ohio. Combined, these 10 States represent 58% of the total Black population.
- Of the 10 largest places in the United States with 100,000 or more population, Detroit, Michigan, had the largest percentage of Blacks (84%), followed by Jackson, Mississippi (80%).
Projected Population Growth
Projected Growth of U.S.-Born Population Between 2014 and 2060
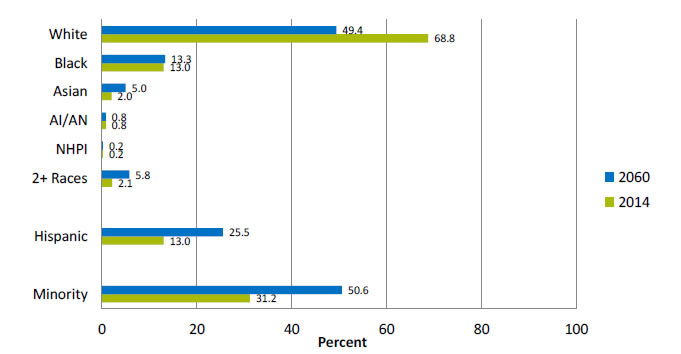
Key: AI/AN = American Indian Alaska Native; NHPI = Native Hawaiian and Pacific Islander.
Source: U.S. Census Bureau. Projections of the Size and Composition of the U.S. Population: 2014 to 2060. Population Estimates and Projections. Current Population Reports, March 2015. http://www.census.gov/newsroom/press-releases/2015/cb15-tps16.html.
Note: The percentages for each group in each year may not add to 100 due to rounding. Unless otherwise specified, race categories represent race alone. Minority refers to everyone other than the non-Hispanic White alone population.
- Between 2014 and 2060, the Black population is projected to increase moderately, from 13% to 14% of the total population (data not shown).
- The U.S.-born Black population is not expected to change much over the next four decades.
Projected Growth of Foreign-Born Population Between 2014 and 2060
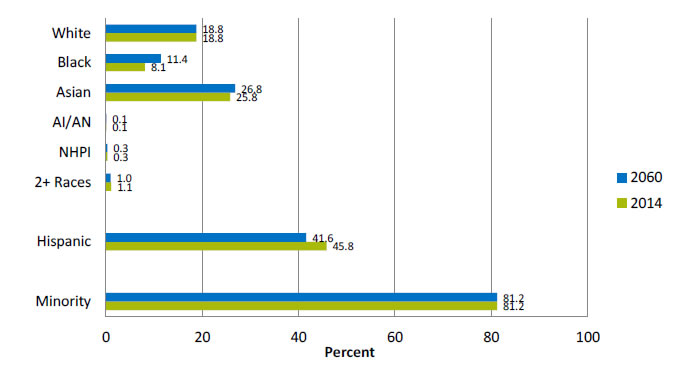
Key: AI/AN = American Indian Alaska Native; NHPI = Native Hawaiian and Pacific Islander.
Source: U.S. Census Bureau. Projections of the Size and Composition of the U.S. Population: 2014 to 2060. Population Estimates and Projections. Current Population Reports, March 2015. http://www.census.gov/newsroom/press-releases/2015/cb15-tps16.html.
Note: The percentages for each group in each year may not add to 100 due to rounding. Unless otherwise specified, race categories represent race alone. Minority refers to everyone other than the non-Hispanic White alone population.
- Between 2014 and 2060 the percentage of foreign-born Blacks is expected to increase from 8.1% in 2014 to 11.4% in 2060.
Projected Growth of Older Black Population Between 2014 and 2060
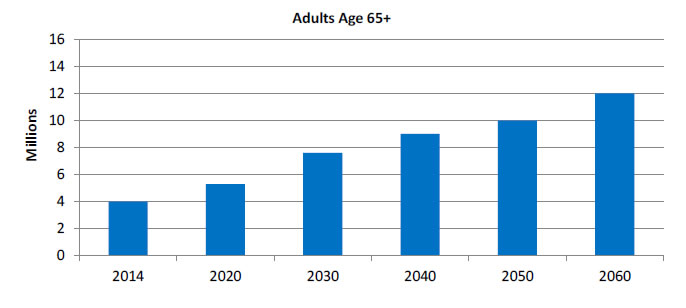
Source: Administration on Aging. A statistical profile of Black older Americans aged 65+. https://acl.gov/sites/default/files/Aging%20and%20Disability%20in%20America/Statistical-Profile-Older-African-Ameri.pdf.
- The non-Hispanic Black older population was 4 million in 2014 and is projected to grow to 12 million by 2060. In 2014, Blacks made up 9% of the older population. By 2060, the percentage of the older population that is Black is projected to grow to 12%.
- Centenarians: In 2014, there were 8,582 Blacks age 100 years and over (1,558 men and 7,024 women). They made up 12% of all centenarians.
- Residence: In 2013, more than half of older Blacks lived in eight States: New York (331,114), Florida (286,438), Texas (255,362), Georgia (252,101), California (248,195), North Carolina (221,725), Illinois (196,584), and Maryland (177,521).
- Self-Rated Health Status: During 2011-2013, 27% of both older Black men and older Black women reported very good/excellent health status. Among older non-Hispanic Whites, this figure was 45% for men and 47% for women. Positive health evaluations decline with age. Among Black men ages 65-74, 31% reported very good/excellent health compared with 17% among those age 85 and over. Similarly, among Black women, this rate declined from 30% at ages 65-74 to 20% at age 85 and over.
- Chronic Conditions:
- Most older people have at least one chronic condition and many have multiple conditions. Some of the most frequently occurring conditions among older non-Hispanic Blacks in 2011-2013 were:
- Hypertension (85% in 2009-2012).
- Diagnosed arthritis (51%).
- All types of heart disease (27%).
- Diagnosed diabetes (39% in 2009-2012).
- Cancer (17%).
- The comparable figures for all older persons were: hypertension (71% in 2009-2012), diagnosed arthritis (49%), all types of heart disease (31%), diagnosed diabetes (21% in 2009-2012), and cancer (25%).
- Most older people have at least one chronic condition and many have multiple conditions. Some of the most frequently occurring conditions among older non-Hispanic Blacks in 2011-2013 were:
- Access to Medical Care: In 2013, 34% of older Blacks had both Medicare and supplementary private health insurance and 11% were covered by both Medicare and Medicaid. In comparison, almost 50% of all older adults had both Medicare and supplementary private health insurance and 6% were covered by both Medicare and Medicaid. In 2011-2013, 4% of older non-Hispanic Blacks reported they had no usual source of health care, the same as the percentage for all older Americans.
Health of the Black Population in the United States
- Health of Blacks is influenced by various social determinants, such as poverty, lack of access to high-quality education, unemployment, unhealthy housing, unsafe neighborhoods, and other cultural barriers.
- Social determinants of health are economic and physical conditions in the environments in which people are born, live, learn, work, play, worship, and age that affect a wide range of health, functioning, and quality-of-life outcomes and risks.
- Blacks have higher rates of mortality than any other racial or ethnic group for 8 of the top 10 causes of death.
Source: Kelly RL. 2015 Kelly report: health disparities in America. https://cbcbraintrust-kelly.house.gov/media-center/kelly-report.


