Well-Child Visits
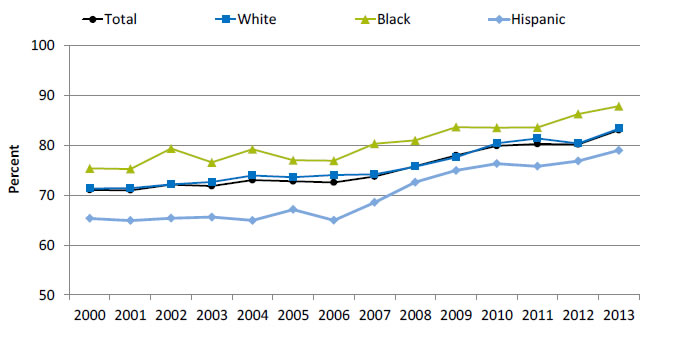
Children ages 0-17 with a well-child visit in the last 12 months, by race/ethnicity, 2000-2013
| Year | Total | White | Black | Hispanic |
|---|---|---|---|---|
| 2000 | 71.0 | 71.3 | 75.4 | 65.3 |
| 2001 | 71.0 | 71.4 | 75.2 | 64.9 |
| 2002 | 72.1 | 72.1 | 79.4 | 65.4 |
| 2003 | 71.8 | 72.7 | 76.5 | 65.6 |
| 2004 | 73.0 | 73.9 | 79.2 | 64.9 |
| 2005 | 72.8 | 73.6 | 77.0 | 67.1 |
| 2006 | 72.5 | 74.0 | 76.9 | 64.9 |
| 2007 | 73.7 | 74.1 | 80.3 | 68.5 |
| 2008 | 75.8 | 75.7 | 81.0 | 72.6 |
| 2009 | 78.0 | 77.6 | 83.6 | 74.9 |
| 2010 | 79.9 | 80.4 | 83.5 | 76.3 |
| 2011 | 80.3 | 81.3 | 83.6 | 75.8 |
| 2012 | 80.2 | 80.3 | 86.3 | 76.8 |
| 2013 | 83.0 | 83.3 | 87.8 | 79.0 |
Source: Centers for Disease Control and Prevention, National Center for Health Statistics, National Health Interview Survey, 2000-2013.
- Trends:
- Overall, the percentage of children ages 0-17 years who had a well-child visit (as distinct from a symptom-driven visit) in the last 12 months increased from 71% in 2000 to 83% in 2013.
- From 2000 to 2013, the percentage of children who had a well-child visit increased significantly for Whites (71.3% to 83.3%), Blacks (75.4% to 87.8%), and Hispanics (65.3% to 79.0%).
- Groups With Disparities:
- In all years, Hispanic children were less likely than White children to have had a well-child visit.
- In 12 of 14 years, Black children were less likely than White children to have had a well-child visit.
Receipt of Vaccinations by Children
The U.S. Surgeon General, Dr. Vivek H. Murthy, and Elmo want everyone to stay healthy and get vaccinated! https://youtu.be/viS1ps0r4K0
Receipt of 4:3:1:3:3:1:4 Vaccine Series
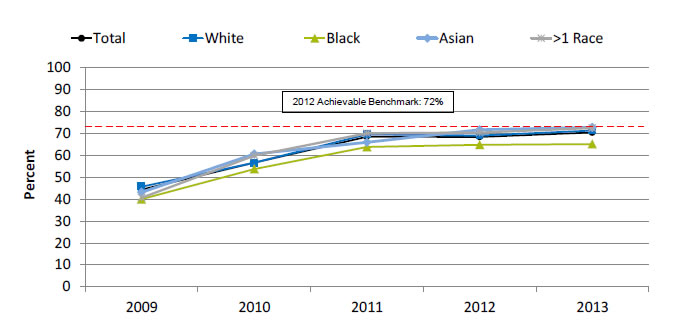
Children ages 19-35 months who received the 4:3:1:3:3:1:4 vaccine series, by race, 2009-2013
| Race | 2009 | 2010 | 2011 | 2012 | 2013 |
|---|---|---|---|---|---|
| Total | 44.3 | 56.6 | 68.5 | 68.4 | 70.4 |
| Asian | 43.1 | 60.6 | 65.9 | 71.7 | 72.8 |
| Black | 40.0 | 53.7 | 63.8 | 64.8 | 65.1 |
| White | 45.7 | 56.6 | 69.5 | 69.0 | 71.3 |
| >1 Race | 40.6 | 59.8 | 70.0 | 70.4 | 72.4 |
2012 Achievable Benchmark: 72%.
Source: Centers for Disease Control and Prevention, National Center for Health Statistics and National Center for Immunization and Respiratory Diseases, National Immunization Survey, 2009-2013.
Note: The 4:3:1:3:3:1:4 vaccine series refers to 4 or more doses of diphtheria and tetanus toxoids and pertussis vaccine, or diphtheria and tetanus toxoids; 3 or more doses of poliovirus vaccine; 1 or more doses of measles antigen-containing vaccine, including measles-mumps-rubella; 3 or more doses of Haemophilus influenzae (Hib) type b vaccine; 3 or more doses of hepatitis B vaccine; 1 or more doses of varicella vaccine; and 4 or more doses of pneumococcal conjugate vaccine. Full series of Hib vaccine is ≥3 or ≥4 doses, depending on brand type.
- Trends:
- From 2009 to 2013, the percentage of children ages 19-35 months who received the 4:3:1:3:3:1:4 vaccination series improved from 44.3% to 70.4%.
- From 2009 to 2013, the percentage of children who received all recommended vaccinations improved for Blacks (40.0% to 65.1%), Asians (43.1% to 72.8%), multiple-race children (40.6% to 72.4%), and Whites (45.7% to 71.3%).
- Groups With Disparities: In 4 of 5 years, Black children were less likely than White children to receive all recommended vaccines.
- Achievable Benchmark:
- The 2012 top 5 State achievable benchmark was 72%. The top 5 States that contributed to the achievable benchmark are Louisiana, Maryland, Massachusetts, New Hampshire, and Ohio.
- Black children could achieve the benchmark within a year. White children could achieve the benchmark in less than a year. Asian and multiple-race children have already achieved the benchmark.
Advice to Adults About Exercise
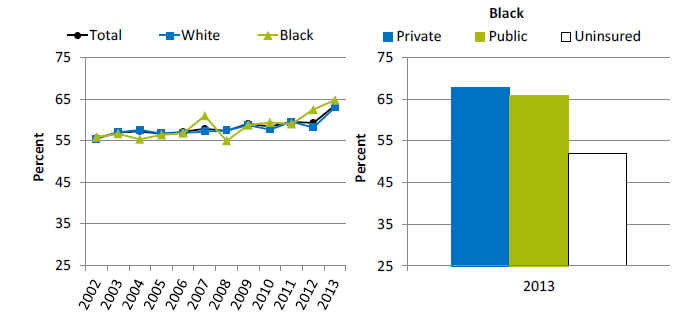
Adults with obesity who ever received advice from a health provider to exercise more, by race, 2002-2013, and by health insurance, Blacks, 2013
Left Chart:
| Race | 2002 | 2003 | 2004 | 2005 | 2006 | 2007 | 2008 | 2009 | 2010 | 2011 | 2012 | 2013 |
|---|---|---|---|---|---|---|---|---|---|---|---|---|
| Total | 55.6 | 57.0 | 57.2 | 56.7 | 57.1 | 57.9 | 57.4 | 59.1 | 58.4 | 59.6 | 59.3 | 63.5 |
| White | 55.4 | 57.1 | 57.6 | 56.8 | 56.9 | 57.2 | 57.4 | 58.7 | 57.7 | 59.5 | 58.2 | 63 |
| Black | 55.9 | 56.7 | 55.3 | 56.4 | 56.8 | 61.0 | 55.0 | 58.8 | 59.4 | 59.0 | 62.5 | 64.8 |
Right Chart (Health insurance, Blacks, 2013):
- Private - 67.8.
- Public - 66.
- Uninsured - 51.9.
Source: Agency for Healthcare Research and Quality, Medical Expenditure Panel Survey, 2002-2013.
Denominator: Civilian noninstitutionalized adults age 18 and over with obesity.
Note: Estimates are age adjusted to the 2000 U.S. standard population using three age groups: 18-44, 45-64, and 65 and over. Obesity is defined as a body mass index of 30 or higher.
- Overall Rate: In 2013, overall, 63.5% of adults with obesity had ever received advice from a health provider to exercise more.
- Trends: From 2002 to 2013, the percentage of obese adults who ever received advice from a health provider to exercise more improved for Blacks (from 55.9% to 64.8%).
- Groups With Disparities:
- In 11 of 12 years, there were no statistically significant differences between Whites and Blacks in the percentage of adults with obesity who ever received advice from a health provider to exercise more. In 2012, the percentage of Black adults with obesity who received advice to exercise (62.5%) was higher compared with White adults with obesity (58.2%).
- In 2013, among Black adults with obesity, the percentage who ever received advice from a health provider to exercise more was lower for those without insurance (51.9%) compared with those with private insurance (67.8%).
Advice to Adults About Healthy Eating
Adults with obesity who ever received advice to eat fewer high-fat or high-cholesterol foods, by race, 2002-2013, and by health insurance, Blacks, 2013

Left Chart:
| Race | 2002 | 2003 | 2004 | 2005 | 2006 | 2007 | 2008 | 2009 | 2010 | 2011 | 2012 | 2013 |
|---|---|---|---|---|---|---|---|---|---|---|---|---|
| Total | 47.7 | 48.3 | 47.4 | 48.1 | 48.5 | 50.0 | 49.2 | 51.3 | 51.4 | 50.6 | 50.2 | 51.3 |
| White | 47.6 | 48.5 | 48.3 | 48.6 | 49.0 | 49.5 | 49.1 | 51.0 | 50.3 | 50.6 | 49.4 | 51.4 |
| Black | 46.8 | 47.3 | 44.8 | 47.3 | 45.4 | 51.7 | 48.3 | 50.5 | 54.5 | 51.1 | 52.3 | 49.3 |
Right Chart (Health insurance, Blacks, 2013):
- Private - 51.6.
- Public - 47.
- Uninsured - 35.4.
Source: Agency for Healthcare Research and Quality, Medical Expenditure Panel Survey, 2002-2012.
Denominator: Civilian noninstitutionalized adults age 18 and over with obesity.
Note: Estimates are age adjusted to the 2000 U.S. standard population using three age groups: 18-44, 45-64, and 65 and over. Obesity is defined as a body mass index of 30 or higher.
- Overall Rate: In 2013, overall, 51.3% of adults with obesity had ever received advice from a health provider about eating fewer high-fat or high-cholesterol foods.
- Trends: From 2002 to 2013, the percentage of adults with obesity who ever received advice about healthy eating improved for Blacks (from 46.8% to 49.3%).
- Groups With Disparities:
- There were no statistically significant differences between Whites and Blacks in the percentage of adults with obesity who ever received advice about healthy eating.
- In 2013, among Black adults with obesity, the percentage who ever received advice about healthy eating was lower for those without insurance (35.4%) compared with those with private insurance (51.6%).
AHRQ Health Care Innovations in Healthy Eating
- Location: Columbia, South Carolina.
- Population: Black women.
- Intervention: Using culturally tailored materials and techniques, primary care physicians and nurses engage patients in motivational counseling and goal setting. Health educators provide additional support and counseling during monthly calls.
- Outcomes: Reduced dietary fat intake and increased leisure time physical activity.
Pneumococcal and Influenza Immunization
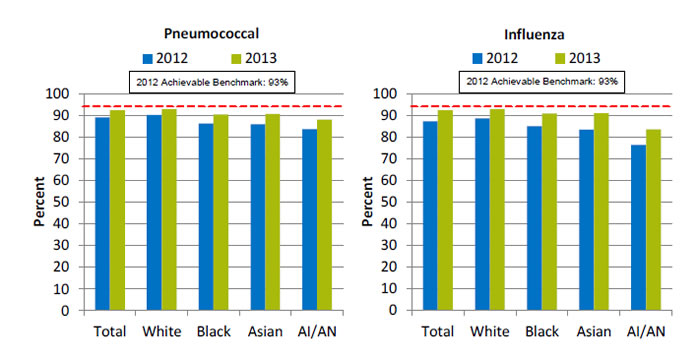
Hospital patients who received pneumococcal immunization and influenza immunization (right), by race 2012-2013
Left Chart (Pneumococcal):
| Race | 2012 | 2013 |
|---|---|---|
| Total | 89 | 92.2 |
| White | 90 | 92.8 |
| Black | 86.1 | 90.3 |
| Asian | 85.7 | 90.5 |
| AI/AN | 83.5 | 87.9 |
Right Chart (Influenza):
| Race | 2012 | 2013 |
|---|---|---|
| Total | 87.2 | 92.2 |
| White | 88.6 | 92.8 |
| Black | 84.9 | 90.7 |
| Asian | 83.3 | 90.8 |
| AI/AN | 76.3 | 83.4 |
2012 Achievable Benchmark: 93%.
Key: AI/AN = American Indian or Alaska Native.
Source: Centers for Medicare & Medicaid Services, Medicare Quality Improvement Organization Program, 2012-2013.
Denominator for Pneumococcal Immunization: Discharged hospital patients age 65 and over or ages 6-64 with a high-risk condition.
Denominator for Influenza Immunization: Hospital patients discharged in October-March.
- Importance: Hospitals are important sites for ensuring that people receive needed immunizations, including pneumococcal and influenza immunizations.
- Pneumococcal Immunization:
- Overall Rate: In 2013, 92.2% of hospital patients received pneumococcal immunization.
- Groups With Disparities: In both years, the percentage of hospital patients who received pneumococcal immunization was lower among Blacks, Asians, and AI/ANs compared with Whites.
- Achievable Benchmark: The 2012 top 5 State achievable benchmark was 93%. The top 5 States that contributed to the achievable benchmark are Delaware, Florida, Ohio, South Carolina, and West Virginia. All groups were below the benchmark.
- Influenza Immunization:
- Overall Rate: In 2013, 92.2% of hospital patients received influenza immunization.
- Groups With Disparities: In both years, the percentage of hospital patients who received pneumococcal immunization was lower among Blacks, Asians, and AI/ANs compared with Whites.
- Achievable Benchmark: The 2012 top 5 State achievable benchmark was 93%. The top 5 States that contributed to the achievable benchmark are Delaware, Maryland, New Hampshire, South Carolina, and West Virginia. All groups were below the benchmark except for Whites are close to the benchmark.
Improvement in Mobility Among Home Health Patients
Adult home health patients whose ability to move or walk around improved, by race, 2010-2013
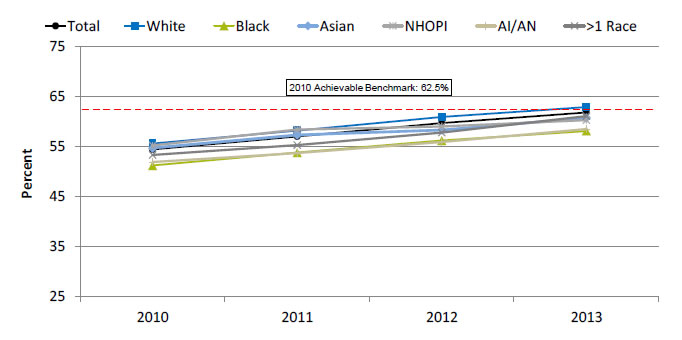
| Race | 2010 | 2011 | 2012 | 2013 |
|---|---|---|---|---|
| Total | 54.4 | 57 | 59.7 | 61.8 |
| White | 55.6 | 58.2 | 60.9 | 62.9 |
| Black | 51.2 | 53.8 | 56.2 | 58.1 |
| Asian | 54.7 | 57.3 | 58.3 | 60.7 |
| NHOPI | 55.2 | 58.4 | 59 | 60.3 |
| AI/AN | 51.9 | 53.7 | 55.9 | 58.5 |
| >1 Race | 53.3 | 55.3 | 57.8 | 61.1 |
2010 Achievable Benchmark: 62.5%.
Key: NHOPI = Native Hawaiian or Other Pacific Islander; AI/AN = American Indian or Alaska Native.
Source: Centers for Medicare & Medicaid Services, Outcome and Assessment Information Set (OASIS), 2010-2013.
Denominator: Adult nonmaternity patients completing an episode of skilled home health care.
Note: Starting January 1, 2010, the patient assessment instrument for home health agencies was changed to OASIS-C. Improvement is measured compared with prior assessment period. Racial groups refer to single race (e.g., White only).
- Importance: Many patients who receive home health care are recovering from an injury or illness and may have difficulty walking or moving around safely. Maintaining and improving functional status, such as patients’ ability to ambulate, improves quality of life and allows them to stay at home as long as possible. Getting better at walking or moving around may be a sign that their health is improving.
- Overall Rate: In 2013, 61.8% of home health patients showed improvement in walking or moving around.
- Trends: From 2010 to 2013, the percentage of adult home health patients whose ability to move or walk around improved overall and for all racial groups.
- Groups With Disparities: From 2011 to 2013, White home health patients were more likely than Black and AI/AN home health patients to get better at walking or moving around.
- Achievable Benchmark:
- The 2010 top 5 State achievable benchmark was 62.5%. The top 5 States that contributed to the achievable benchmark are Maine, Missouri, New Jersey, South Carolina, and Utah.
- Whites have already achieved the benchmark. At current rates of improvement, the overall, multiple-race, and Asian rates could reach the benchmark within a year. The other racial groups could reach the benchmark within 2 years.
Shortness of Breath in Home Health Patients
Adult home health patients whose episodes of shortness of breath decreased, by race, 2010-2013
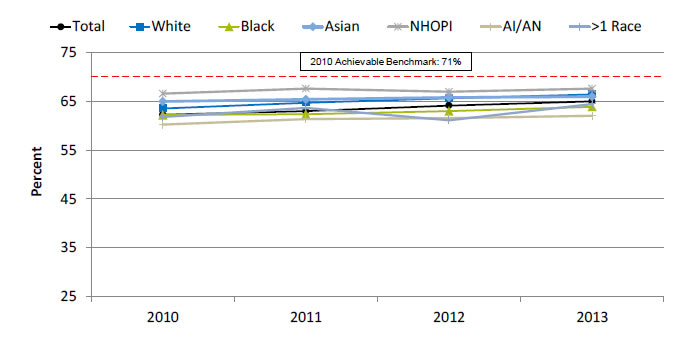
| Race | 2010 | 2011 | 2012 | 2013 |
|---|---|---|---|---|
| Total | 62.3 | 63.0 | 64.2 | 65.0 |
| White | 63.6 | 64.8 | 65.7 | 66.5 |
| Black | 62.2 | 62.4 | 63.0 | 63.9 |
| Asian | 65.0 | 65.5 | 65.9 | 66.0 |
| NHOPI | 66.6 | 67.6 | 67.0 | 67.7 |
| AI/AN | 60.3 | 61.4 | 61.6 | 62.1 |
| >1 Race | 61.8 | 63.7 | 61.1 | 64.5 |
2010 Achievable Benchmark: 71%.
Key: NHOPI = Native Hawaiian or Other Pacific Islander; AI/AN = American Indian or Alaska Native.
Source: Centers for Medicare & Medicaid Services, Outcome and Assessment Information Set (OASIS), 2010-2013.
Denominator: Adult nonmaternity patients completing an episode of skilled home health care.
Note: Starting January 1, 2010, the patient assessment instrument for home health agencies was changed to OASIS-C. Improvement is measured compared with prior assessment period. Racial groups refer to single race (e.g., White only).
- Importance: Many patients who receive home health care are recovering from an injury or illness and may have difficulty walking or moving around safely. Maintaining and improving functional status, such as patients’ ability to ambulate, improves quality of life and allows them to stay at home as long as possible. Shortness of breath interferes with activities such as walking and is an important health status indicator.
- Overall Rate: In 2013, 65.0% of home health patients had less shortness of breath.
- Trends: From 2010 to 2013, the percentage of adult home health patients whose episodes of shortness of breath decreased improved overall and for AI/ANs, Blacks, and Whites.
- Groups With Disparities: In 2 of 4 years, AI/ANs were less likely than Whites to show improvement in shortness of breath.
- Achievable Benchmark:
- The 2010 top 5 State achievable benchmark was 71%. The top 5 States that contributed to the achievable benchmark are District of Columbia, Hawaii, Maryland, New Jersey, and South Carolina.
- At current rates of improvement, the overall rate could reach the benchmark in 6 years and the racial groups could achieve the benchmark within 9 years.
Management of Oral Medications by Home Health Patients
Adult home health patients whose management of oral medications improved, by race, stratified by age, 2013
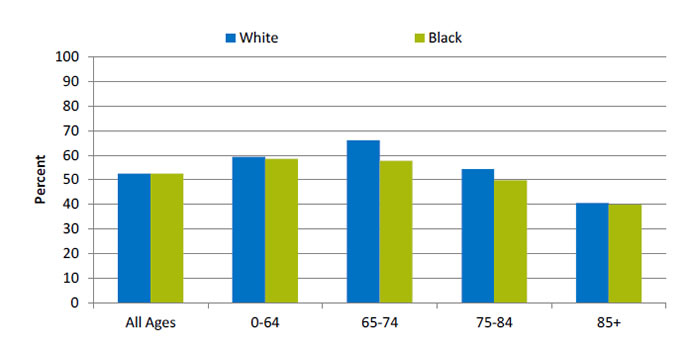
| Age | Black | White |
|---|---|---|
| All Ages | 52.5 | 52.6 |
| 0-64 | 58.5 | 59.4 |
| 65-74 | 57.7 | 66.1 |
| 75-84 | 49.8 | 54.3 |
| 85+ | 39.8 | 40.5 |
Source: Centers for Medicare & Medicaid Services, Outcome and Assessment Information Set, 2012.
Note: Improvement is measured compared with prior assessment period.
- Importance: Patients who have problems taking their medications as prescribed are at risk for adverse outcomes, including lack of improvement, worsening of disease, serious side effects, and death.
- Overall Rate: In 2013, 52.5% of Black home health patients got better at taking their medications.
- Groups With Disparities: In 2013, Black home health patients in age groups 75-84 (49.8%) and 85 and over (39.8%) were less likely than those ages 0-64 (58.5%) to get better at taking their medications.
Return to Contents
Return to National Quality Strategy Priorities


