- Patient Safety is the first of six National Quality Strategy (NQS) Priorities to be covered by this chartbook. The other five Priorities are Person- and Family-Centered Care, Care Coordination, Effective Treatment, Healthy Living, and Care Affordability.
Postoperative Sepsis
Postoperative sepsis per 1,000 adult discharges with an elective operating room procedure, by race/ethnicity, 2008-2013, stratified by insurance status, Blacks and Whites, 2013
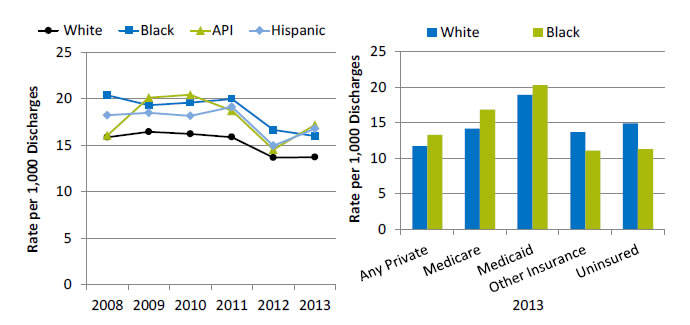
Left Chart:
| Year | White | API | Hispanic | Black | Total |
|---|---|---|---|---|---|
| 2008 | 15.85 | 16.05 | 18.22 | 20.38 | 16.42 |
| 2009 | 16.43 | 20.11 | 18.47 | 19.30 | 17.05 |
| 2010 | 16.21 | 20.41 | 18.15 | 19.57 | 16.82 |
| 2011 | 15.86 | 18.71 | 19.11 | 19.97 | 16.58 |
| 2012 | 13.65 | 14.52 | 14.94 | 16.63 | 14.16 |
| 2013 | 13.70 | 17.17 | 16.76 | 15.98 | 14.28 |
Right Chart:
| Race | Any Private | Medicare | Medicaid | Other Insurance | Uninsured |
|---|---|---|---|---|---|
| White | 11.7 | 14.2 | 19.0 | 13.7 | 14.9 |
| Black | 13.3 | 16.9 | 20.3 | 11.1 | 11.3 |
Key: API = Asian or Pacific Islander.
Source: Agency for Healthcare Research and Quality (AHRQ), Healthcare Cost and Utilization Project, Nationwide Inpatient Sample, 2008-2013, and AHRQ Quality Indicators, modified version 4.4.
Denominator: All elective hospital surgical discharges for patients age 18 and over with length of stay of 4 or more days, excluding patients admitted for infection, those with cancer or immunocompromised states, those with obstetric conditions, and admissions specifically for sepsis.
Note: Acute care hospitalizations only. For this measure, lower rates are better. Rates are adjusted by age, sex, age-sex interactions, comorbidities, major diagnostic category, diagnosis-related group, and transfers into the hospital. White, Black, and API are non-Hispanic. Hispanic includes all races.
- Overall Rate: In 2013, the postoperative sepsis rate was 14.3 per 1,000 adult discharges with an elective operating room procedure (data not shown).
- Trends: From 2008 to 2013, there were no statistically significant changes overall or for any racial/ethnic group in the rate of postoperative sepsis.
- Groups With Disparities:
- In all years, Hispanic patients and Black patients had higher rates of postoperative sepsis than their White counterparts.
- In 2013, among Medicare patients, the rate of postoperative sepsis was higher for Blacks than for Whites. Black-White differences in other insurance groups were not statistically significant.
Colorectal Surgery Mortality
Unadjusted mortality rate (%) 30 days postoperation for colorectal surgeries among ACS NSQIP participating hospitals in the United States, by race/ethnicity, 2008-2013
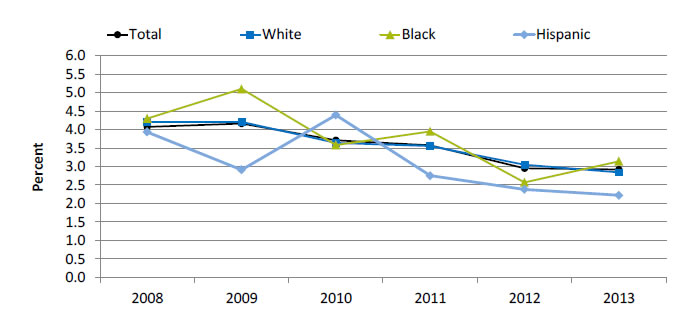
| Race/Ethnicity | 2008 | 2009 | 2010 | 2011 | 2012 | 2013 |
|---|---|---|---|---|---|---|
| Hispanic | 3.93 | 2.91 | 4.39 | 2.75 | 2.38 | 2.22 |
| Black | 4.30 | 5.10 | 3.58 | 3.95 | 2.57 | 3.14 |
| White | 4.21 | 4.21 | 3.64 | 3.55 | 3.05 | 2.84 |
| Total | 4.07 | 4.16 | 3.71 | 3.57 | 2.95 | 2.92 |
Source: American College of Surgeons (ACS), National Surgical Quality Improvement Program (NSQIP), 2008-2013.
Note: For this measure, lower rates are better. These data may not represent U.S. hospitals, as participation in ACS NSQIP is voluntary and current participation is weighted when calculating rates; participating hospitals have changed over time (i.e., some hospitals have dropped out and others have enrolled); and 32% more hospitals participated in 2013 than 2008. Some portion of the variation in raw mortality rate observed over time may be due to these sampling issues. White and Black are non-Hispanic. Hispanic includes all races.
- Importance: Colon and rectal procedures are ranked among the most harmful procedures, with high rates of postoperative complications, which are often a result of nonadherence to best practices.
- Overall Rate: In 2013, the unadjusted rate of 30-day postoperative mortality for colorectal surgeries was 2.9% among ACS-NSQIP participating hospitals in the United States.
- Trend: From 2008 to 2013, rates decreased by 44% among Hispanics, 27% among Blacks, and 33% among Whites.
- Groups With Disparities:
- In 2013, 30-day postoperative mortality rates were higher for Blacks (3.1%) compared with Whites (2.8%).
- In 4 of 5 years, Blacks had higher rates compared with Whites.
Medical Care Visits Due to Adverse Effects of Medical Care
Adult ambulatory medical care visits due to adverse effects of medical care per 1,000 population, by race, stratified by sex, United States, 2008-2009, combined
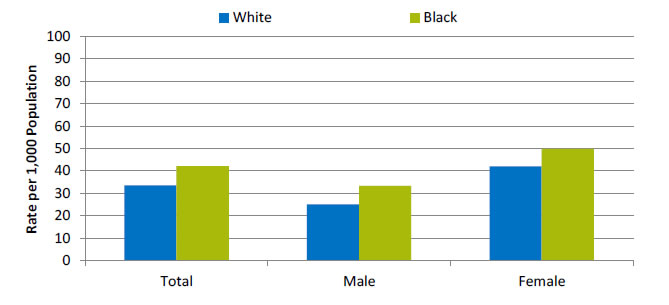
| Sex | White | Black |
|---|---|---|
| Total | 33.6 | 42.1 |
| Male | 25.1 | 33.2 |
| Female | 42 | 49.8 |
Source: Centers for Disease Control and Prevention, National Center for Health Statistics, National Ambulatory Medical Care Survey and National Hospital Ambulatory Medical Care Survey, 2008-2009.
- Importance:
- Adverse effects of medical care can arise from medical and surgical procedures as well as from adverse drug reactions. Although patient safety initiatives focus mainly on inpatient hospital events, adverse effects of medical care are much more commonly treated at visits to outpatient settings, with more than 12 million such visits occurring annually. Providers treating adverse events in outpatient settings may include office-based physicians, hospital outpatient departments, and hospital emergency departments.
- Events treated in ambulatory settings may be less severe than those occurring in inpatient settings. Some adverse events, such as known side effects of appropriately prescribed medications, may be unavoidable, while others may be considered medical errors. Although the measure here does not distinguish between the two types of events, it provides an overall sense of the burden these events place on the population.
- Overall Rate: In 2008-2009, the rate of ambulatory care visits for adverse effects of medical care was 33.2 per 1,000 population (data not shown).
- Groups With Disparities: In 2008-2009, there were no statistically significant differences between Blacks and Whites in rates of ambulatory care visits for adverse effects of medical care.
Long-Stay Nursing Home Residents With Urinary Tract Infections
Long-stay nursing home residents experiencing urinary tract infections, by race, 2012-2013
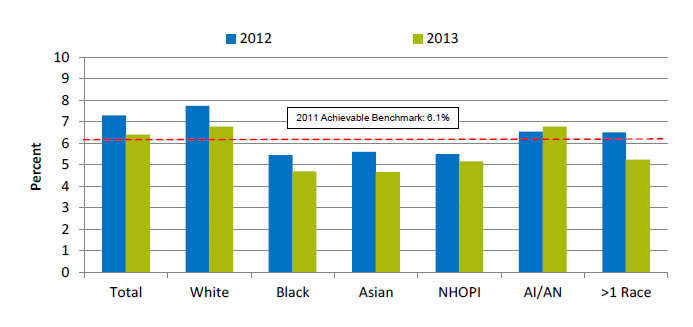
| Race | 2012 | 2013 |
|---|---|---|
| Total | 7.3 | 6.4 |
| White | 7.7 | 6.8 |
| Black | 5.5 | 4.7 |
| Asian | 5.6 | 4.7 |
| NHOPI | 5.5 | 5.2 |
| AI/AN | 6.6 | 6.8 |
| >1 Race | 6.5 | 5.2 |
2011 Achievable Benchmark: 6.1%.
Key: NHOPI = Native Hawaiian or Other Pacific Islander; AI/AN = American Indian or Alaska Native.
Source: Centers for Medicare & Medicaid Services, Minimum Data Set 3.0, 2014.
Denominator: Long-stay residents, who are defined as having a cumulative stay greater than 100 days.
Note: For this measure, lower rates are better. The measure was calculated as follows: Percentage of long-stay residents with a urinary tract infection within the 30 days prior to assessment.
- Importance: Urinary tract infections (UTIs) can spread and become more serious or cause further complications, such as delirium.
- Overall Rate: In 2013, the percentage of long-stay nursing home residents with a UTI was 6.4%.
- Groups With Disparities: In 2013, Black, Asian, and Native Hawaiian and Other Pacific Islander (NHOPI) nursing home residents had lower rates of UTIs compared with White residents.
- Achievable Benchmark:
- In 2011, the top 5 State achievable benchmark for UTIs was 6.1%. The States that contributed to the achievable benchmark are Connecticut, Hawaii, Minnesota, North Dakota, and Pennsylvania.
- In both 2012 and 2013, Blacks, Asians, and NHOPIs all achieved the 2011 benchmark of 6.1%, with Blacks and Asians having the best rate among all racial groups (4.7%) in 2013.
Long-Stay Nursing Home Residents With Restraints
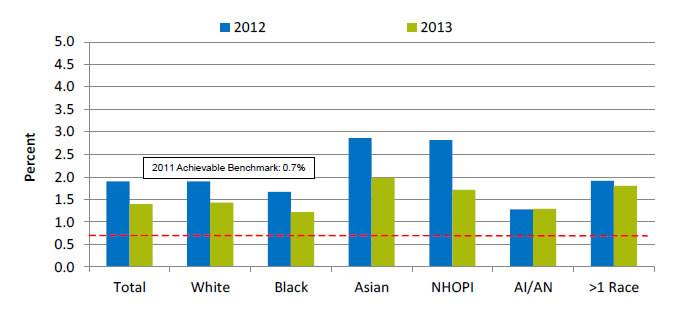
Long-stay nursing home residents experiencing use of restraints, by race, 2012-2013
| Race | 2012 | 2013 |
|---|---|---|
| Total | 1.9 | 1.4 |
| White | 1.9 | 1.4 |
| Black | 1.7 | 1.2 |
| Asian | 2.9 | 2.0 |
| NHOPI | 2.8 | 1.7 |
| AI/AN | 1.3 | 1.3 |
| >1 Race | 1.9 | 1.8 |
2011 Achievable Benchmark: 0.7%.
Key: NHOPI = Native Hawaiian or Other Pacific Islander; AI/AN = American Indian or Alaska Native.
Source: Centers for Medicare & Medicaid Services, Minimum Data Set 3.0, 2014.
Denominator: Long-stay residents, who are defined as having a cumulative stay greater than 100 days.
Note: For this measure, lower rates are better. The measure was calculated as follows: Percentage of long-stay residents who are physically restrained on a daily basis..
- Importance: Residents who are restrained can become weak, lose their ability to go to the bathroom by themselves, and develop pressure ulcers or other medical conditions.
- Overall Rate: In 2013, the percentage of long-stay nursing home residents who were physically restrained was 1.4%.
- Groups With Disparities: In 2013, the percentage of nursing home residents with restraints was higher for Asians (2.0%) than for Whites (1.4%). The percentage was lower for Blacks (1.2%), who had the lowest percentage among all racial groups.
- Achievable Benchmark:
- In 2011, the top 5 State achievable benchmark for restraint use was 0.7%. The States that contributed to the achievable benchmark are Kansas, Maine, Nebraska, New Hampshire, and Vermont.
- By 2013, no group had achieved the benchmark.
Return to Contents
Return to National Quality Strategy Priorities


