- Thirty years ago, the Heckler Report found that:
- A smaller percentage of Black women than White women begin prenatal care in the first trimester of pregnancy (63% versus 76% in 1980), a factor related to the high Black infant mortality rate.
- Although Blacks shared in the decline in infant mortality, a significant disparity remained, with Black rates being essentially twice those of Whites, 20.0 versus 10.5 in 1983.
- Among White babies, 5.6% had low birth weight compared with 12.4% of Black babies.
- After adjusting for education, marital status, trimester of first care, parity, and age, Black women still had twice the risk of low birth weight babies compared with White women.
Heckler Infant Mortality and Maternity Care Findings
- The neonatal mortality rate for Blacks in 1981 was 13.4 per 1,000 live births, almost twice the rate for Whites (7.1). The postneonatal mortality rate for Blacks was 6.6, almost twice the 3.4 rate for Whites. In 1983, 11,060 Black babies died before 1 year of age.
- Black women are much more likely to have a teenage birth, an out-of-wedlock birth, or a high-parity birth, all of which are more likely to be unintended and associated with adverse perinatal outcomes.
- In 1982, 61% of Black mothers received care in the first trimester compared with 79% of White mothers. Black mothers were twice as likely as White mothers (10% versus 5%) to receive either no care or care beginning in the third trimester of pregnancy.
- It is also possible that there is a biologic role influencing birth weight that gives a different meaning to low birth weight for Blacks than for Whites. This issue deserves research attention. It is clear, unfortunately, that normal weight Black babies have far higher rates of neonatal mortality.
Maternity Care for Blacks
| Measure | Most Recent Disparity | Disparity Change |
|---|---|---|
| Live-born infants with low birth weight (less than 2,500 grams) | Worse | No Change |
| Live-born infants with very low birth weight (less than 1,500 grams) | Worse | No Change |
| Infant mortality per 1,000 live births (more than 2,499 grams) | Worse | No Change |
| Birth trauma—injury to newborn per 1,000 live births | Same | No Change |
| Obstetric trauma per 1,000 vaginal deliveries without instrument assistance | Better | No Change |
| Obstetric trauma per 1,000 instrument-assisted vaginal deliveries | Better | No Change |
- Trends:
- Low birth weight, infant mortality, birth trauma, and obstetric trauma rates were all improving over time.
- Groups With Disparities:
- Blacks had lower rates of obstetric trauma than Whites.
- Blacks had higher rates of low birth weight and infant mortality and these disparities were not changing over time.
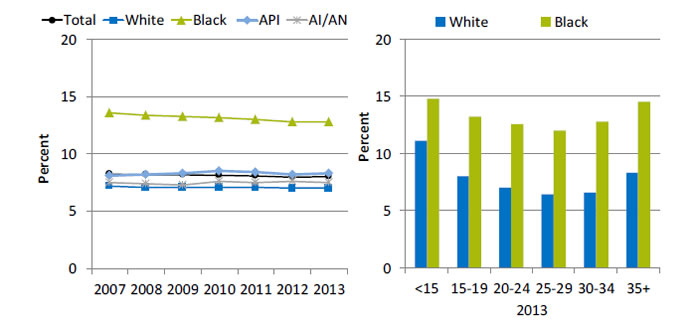
Live-Born Infants With Low Birth Weight
Live-born infants with low birth weight (less than 2,500 grams), by race, 2007-2013, and stratified by mother’s age, Blacks and Whites, 2013

Left Chart:
| Race | 2007 | 2008 | 2009 | 2010 | 2011 | 2012 | 2013 |
|---|---|---|---|---|---|---|---|
| Total | 8.2 | 8.2 | 8.2 | 8.2 | 8.1 | 8.0 | 8.0 |
| AI/AN | 7.5 | 7.4 | 7.3 | 7.6 | 7.5 | 7.6 | 7.5 |
| API | 8.1 | 8.2 | 8.3 | 8.5 | 8.4 | 8.2 | 8.3 |
| Black | 13.6 | 13.4 | 13.3 | 13.2 | 13.0 | 12.8 | 12.8 |
| White | 7.2 | 7.1 | 7.1 | 7.1 | 7.1 | 7.0 | 7.0 |
Right Chart:
| Age | Black | White |
|---|---|---|
| <15 | 14.8 | 11.1 |
| 15-19 | 13.2 | 8.0 |
| 20-24 | 12.6 | 7.0 |
| 25-29 | 12.0 | 6.4 |
| 30-34 | 12.8 | 6.6 |
| 35+ | 14.5 | 8.3 |
Key: API = Asian or Pacific Islander; AI/AN = American Indian or Alaska Native.
Source: Centers for Disease Control and Prevention, National Center for Health Statistics, National Vital Statistics System—Natality, 2007-2013.
Denominator: Live births with known birth weight.
- Importance: In 2012, Black mothers were 2.3 times as likely as White mothers to delay prenatal care to the third trimester or to not receive prenatal care at all (10.0% compared with 4.3%). Adequate prenatal care can help ensure that babies are born full term and at a healthy weight. Low birth weight can put infants at risk of various complications and death.
- Trends: From 2007 to 2013, the percentage of live-born infants with low birth weight decreased among Blacks but did not change overall or for other racial groups.
- Groups With Disparities:
- In all years, Black infants were more likely than White infants to be low birth weight.
- Among all maternal age groups, Black infants were more likely than White infants to be low birth weight.
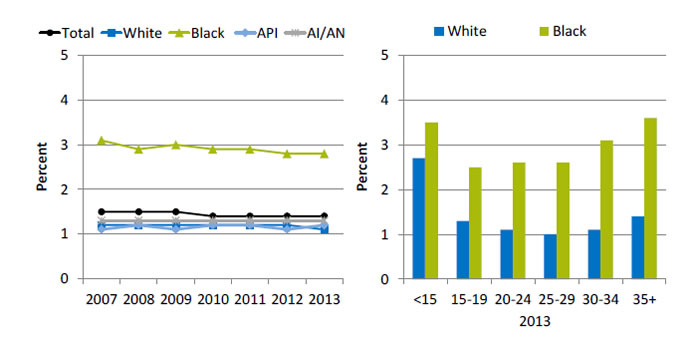
Live-Born Infants With Very Low Birth Weight
Live-born infants with very low birth weight (less than 1,500 grams), by race, 2007-2013, and stratified by mother’s age, Blacks and Whites, 2013

Left Chart:
| Race | 2007 | 2008 | 2009 | 2010 | 2011 | 2012 | 2013 |
|---|---|---|---|---|---|---|---|
| Total | 1.5 | 1.5 | 1.5 | 1.4 | 1.4 | 1.4 | 1.4 |
| AI/AN | 1.3 | 1.3 | 1.3 | 1.3 | 1.3 | 1.3 | 1.3 |
| API | 1.1 | 1.2 | 1.1 | 1.2 | 1.2 | 1.1 | 1.2 |
| Black | 3.1 | 2.9 | 3 | 2.9 | 2.9 | 2.8 | 2.8 |
| White | 1.2 | 1.2 | 1.2 | 1.2 | 1.2 | 1.2 | 1.1 |
Right Chart:
| Age | Black | White |
|---|---|---|
| <15 | 3.5 | 2.7 |
| 15-19 | 2.5 | 1.3 |
| 20-24 | 2.6 | 1.1 |
| 25-29 | 2.6 | 1.0 |
| 30-34 | 3.1 | 1.1 |
| 35+ | 3.6 | 1.4 |
Key: API = Asian or Pacific Islander; AI/AN = American Indian or Alaska Native.
Source: Centers for Disease Control and Prevention, National Center for Health Statistics, National Vital Statistics System—Natality, 2007-2013.
Denominator: Live births with known birth weight.
- Trends: From 2007 to 2013, the percentage of live-born infants with very low birth weight decreased overall and among Blacks but did not change among other racial groups.
- Groups With Disparities:
- In all years, Black infants were more likely than White infants to have very low birth weight.
- Among all maternal age groups, Black infants were more likely than White infants to have very low birth weight.
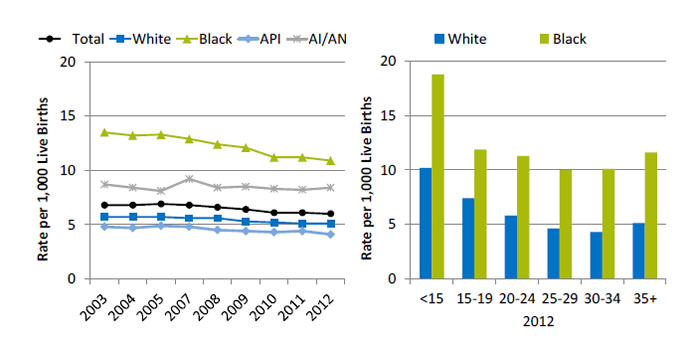
Infant Mortality
Infant mortality per 1,000 live births, all birth weights, by race, 2003-2012, and stratified by mother’s age, Blacks and Whites, 2012

Left Chart:
| Race | 2003 | 2004 | 2005 | 2007 | 2008 | 2009 | 2010 | 2011 | 2012 |
|---|---|---|---|---|---|---|---|---|---|
| Total | 6.8 | 6.8 | 6.9 | 6.8 | 6.6 | 6.4 | 6.1 | 6.1 | 6.0 |
| AI/AN | 8.7 | 8.4 | 8.1 | 9.2 | 8.4 | 8.5 | 8.3 | 8.2 | 8.4 |
| API | 4.8 | 4.7 | 4.9 | 4.8 | 4.5 | 4.4 | 4.3 | 4.4 | 4.1 |
| Black | 13.5 | 13.2 | 13.3 | 12.9 | 12.4 | 12.1 | 11.2 | 11.2 | 10.9 |
| White | 5.7 | 5.7 | 5.7 | 5.6 | 5.6 | 5.3 | 5.2 | 5.1 | 5.1 |
Right Chart:
| Age | Black | White |
|---|---|---|
| <15 | 18.8 | 10.2 |
| 15-19 | 11.9 | 7.4 |
| 20-24 | 11.3 | 5.8 |
| 25-29 | 10.0 | 4.6 |
| 30-34 | 10.1 | 4.3 |
| 35+ | 11.6 | 5.1 |
Key: API = Asian or Pacific Islander; AI/AN = American Indian or Alaska Native.
Source: Centers for Disease Control and Prevention, National Center for Health Statistics, National Vital Statistics System—Linked Birth/Infant Death Data Set, 2003-2012.
Denominator: Live births.
- Importance:
- Blacks have 2.2 times the infant mortality rate of Whites (Mathews, et al., 2015).
- Black infants (260.7 per 100,000 live births) are 3.5 times as likely to die as White infants (74.4 per 100,000 live births) due to complications related to low birth weight (Mathews, et al., 2015).
- Blacks had more than twice the rate of sudden unexpected infant death as Whites (171.8 compared with 84.4 per 100,000 live births) (CDC, no date).
- Trends:
- From 2003 to 2012, the overall rate decreased from 6.8 per 1,000 live births to 6.0.
- The rate of infant mortality per 1,000 live births decreased overall and among all racial groups.
- Groups With Disparities:
- In all years, mortality was significantly higher among Black infants than White infants.
- In 2012, mortality was significantly higher among Black infants than White infants for all maternal age groups.
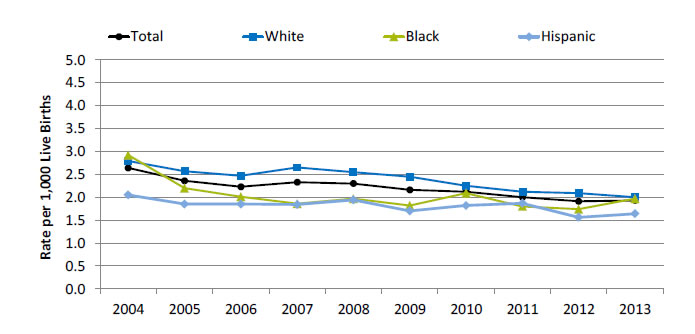
Birth Trauma
Birth trauma—injury to neonate per 1,000 live births, by race/ethnicity, 2004-2013

| Year | Total | White | Black | Hispanic |
|---|---|---|---|---|
| 2004 | 2.64 | 2.79 | 2.92 | 2.05 |
| 2005 | 2.36 | 2.57 | 2.20 | 1.85 |
| 2006 | 2.23 | 2.47 | 2.01 | 1.85 |
| 2007 | 2.33 | 2.65 | 1.86 | 1.84 |
| 2008 | 2.30 | 2.55 | 1.97 | 1.94 |
| 2009 | 2.16 | 2.45 | 1.82 | 1.70 |
| 2010 | 2.12 | 2.25 | 2.09 | 1.82 |
| 2011 | 2.00 | 2.12 | 1.80 | 1.87 |
| 2012 | 1.91 | 2.09 | 1.74 | 1.56 |
| 2013 | 1.93 | 2.00 | 1.97 | 1.64 |
Source: Agency for Healthcare Research and Quality (AHRQ), Healthcare Cost and Utilization Project, State Inpatient Databases, disparities analysis file and AHRQ Quality Indicators, modified version of 4.4.
Note: White and Black are non-Hispanic. Hispanic includes all races.
- Trends:
- From 2004 to 2013, birth trauma-neonatal injury rates fell from 2.6 per 1,000 live births in 2004 to 1.9 per 1,000 live births in 2013.
- Between 2004 and 2012, birth trauma-neonatal injury rates fell for all racial/ethnic groups. Blacks decreased from 2.9 in 2004 to 2.0 in 2013.
- Groups With Disparities:
- In 2013, White and Black neonates both experienced an injury rate of 2.0 per 1,000 live births compared with 1.6 per 1,000 live births for Hispanic neonates.
AHRQ Health Care Innovations in Maternal and Child Health
- Location: Baltimore, Maryland.
- Population: Black women.
- Intervention: Baltimore Healthy Start works to reduce infant mortality by offering services for women and their families. Program covers each stage of the childbearing cycle: pregnancy, postpartum period, early childhood, and between pregnancies. Trained staff from the local community reach out to and enroll at-risk residents, assessing their needs, offering relevant education, and connecting enrollees and their families with needed medical and social services.
- Outcomes: Enhanced access to pre- and postnatal services, generated high levels of satisfaction among clients, produced a lower rate of infant mortality, and reduced the percentage of women delivering low- and very low–birth weight babies. This reduction, in turn, led to significant cost savings.


