- Thirty years ago, the Heckler Report found:
- Prevalence of diabetes was 33% higher in the Black population than in the White population. Diabetes prevalence for Black females was 50% greater than for White females.
- Although diabetes accounts for less than 2 percent of male excess deaths and 5 percent of female excess deaths (to age 70), it is a major risk factor for heart disease and leads to other serious consequences, including amputation and blindness, if uncontrolled.
Diabetes Care for Blacks
| Measure | Most Recent Disparity | Disparity Change |
|---|---|---|
| Adults age 40 and over with diabetes whose condition was diagnosed | Same | Worse |
| Adults age 40 and over with diagnosed diabetes who received all four recommended services for diabetes in the calendar year | Worse | No Change |
| Adults age 40 and over with diagnosed diabetes with hemoglobin A1c under control | Same | Insufficient Data |
| Adults age 40 and over with diagnosed diabetes with blood pressure under control | Worse | No Change |
- Trends: Measures of diabetes care were not improving for Blacks.
- Groups With Disparities:
- After diagnosis, Blacks were less likely than Whites to receive recommended services for diabetes and this disparity was not changing over time.
- Blacks diagnosed with diabetes were less likely than Whites to have their hemoglobin A1c and blood pressure under control and this disparity was not changing over time.
Recommended Services for Diabetes
Adults age 40 and over with diagnosed diabetes who reported receiving four recommended services for diabetes in the calendar year, by race, 2008-2013, and by race stratified by age, 2013

Left Chart:
| Race | 2008 | 2009 | 2010 | 2011 | 2012 | 2013 |
|---|---|---|---|---|---|---|
| Total | 21.0 | 23.2 | 24.6 | 23.6 | 26.6 | 24.0 |
| White | 21.8 | 24.9 | 25.6 | 24.3 | 28.5 | 25.7 |
| Black | 16.6 | 18.2 | 20.0 | 22.3 | 21.5 | 17.0 |
Right Chart:
| Age | Black | White |
|---|---|---|
| 40-59 | 13.7 | 20 |
| 60+ | 22.3 | 34.9 |
Source: Agency for Healthcare Research and Quality, Medical Expenditure Panel Survey, 2008-2013.
Denominator: Civilian noninstitutionalized population with diagnosed diabetes, age 40 and over.
Note: Data include people with both type 1 and type 2 diabetes. The four recommended services are 2+ hemoglobin A1c tests, foot exam, dilated eye exam, and flu shot. Rates are age adjusted to the 2000 U.S. standard population using two age groups: 40-59 and 60 and over.
- Importance:
- Regular hemoglobin A1c (HbA1c) tests, foot exams, dilated eye exams, and flu shots help people keep their diabetes under control and avoid diabetic complications.
- A composite measure is used to track the national rate of receipt of all four of these recommended annual diabetes interventions.
- Trends:
- From 2008 to 2013, among adults age 40 and over with diagnosed diabetes, there were no statistically significant improvements overall or among any racial groups.
- Groups With Disparities:
- In 2013, overall, Blacks were less likely than Whites to receive the recommended services. Among adults age 60 and over, Blacks were also less likely than Whites to receive the recommended services.
- In 2013, among Black adults, those ages 40-59 were less likely than those age 60 and over to receive the recommended services (13.7% compared with 22.3%).
Written Diabetes Management Plans
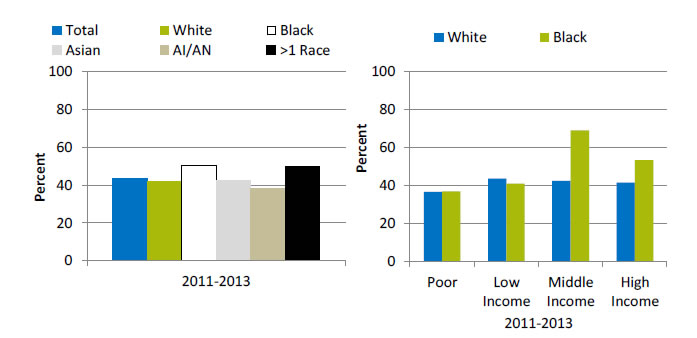
Adults with current diabetes who have a written diabetes management plan, by race and race stratified by income, California, 2011-2013 combined
Left Chart:
| Total | White | Black | Asian | AI/AN | >1 Race |
|---|---|---|---|---|---|
| 43.2 | 41.7 | 50.4 | 42.3 | 38.3 | 49.6 |
Right Chart:
| Income | Black | White |
|---|---|---|
| Poor | 37 | 36.7 |
| Low Income | 41.1 | 43.6 |
| Middle Income | 69.1 | 42.5 |
| High Income | 53.4 | 41.6 |
Key: AI/AN = American Indian or Alaska Native.
Source: UCLA, Center for Health Policy Research, California Health Interview Survey, 2011-2013.
Denominator: Civilian noninstitutionalized population in California.
Note: Poor refers to family income below 100% of the Federal poverty level (FPL); low income refers to income of 100% to 199% of the FPL; middle income refers to income of 200% to 399% of the FPL; and high income refers to income of 400% of the FPL and above. These are based on U.S. census poverty thresholds.
- Importance:
- A successful partnership for diabetes care requires providers to educate patients about daily management of their diabetes. Therefore, providers should develop a written diabetes management plan, especially for patients with a history of uncontrolled diabetes.
- National data on diabetes management and outcomes for some underserved populations are not available from the national data sources in the QDR. These populations include people with limited English proficiency; individuals who speak a language other than English at home; and Black subpopulations. To address some of these data gaps, we show additional data from the California Health Interview Survey.
- Overall Rate: Only 43% of Californians with current diabetes had a written diabetes management plan in 2011-2013.
- Groups With Disparities: Among Black Californians with diabetes, those who were poor were less likely than those with middle and high income to have a written diabetes management plan.
Adults With Diabetes With Hemoglobin A1c and Blood Pressure Under Control
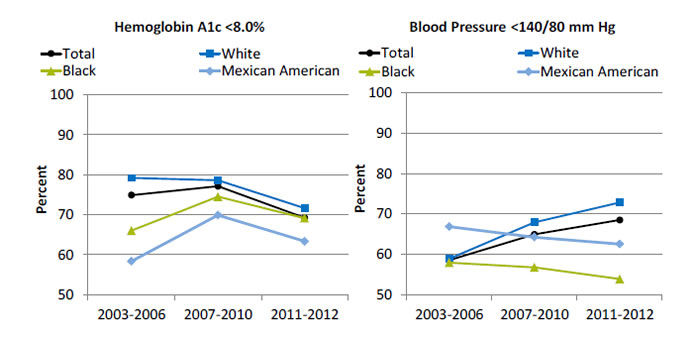
Adults age 40 and over with diagnosed diabetes with hemoglobin A1c and blood pressure under control, by race/ethnicity, 2003-2006, 2007-2010, and 2011-2012
Left Graph:
| Race/Ethnicity | 2003-2006 | 2007-2010 | 2011-2012 |
|---|---|---|---|
| Total | 74.9 | 77.1 | 69.2 |
| Mexican American | 58.3 | 69.9 | 63.3 |
| Black | 66.0 | 74.5 | 69.1 |
| White | 79.2 | 78.6 | 71.6 |
Right Graph:
| Race/Ethnicity | 2003-2006 | 2007-2010 | 2011-2012 |
|---|---|---|---|
| Total | 58.5 | 64.9 | 68.5 |
| Mexican American | 66.8 | 64.2 | 62.5 |
| Black | 57.9 | 56.7 | 53.8 |
| White | 58.9 | 67.9 | 72.8 |
Source: Centers for Disease Control and Prevention, National Center for Health Statistics, National Health and Nutrition Examination Survey, 2003-2006, 2007-2010, and 2011-2012.
Denominator: Civilian noninstitutionalized population with diagnosed diabetes, age 40 and over.
Note: Age adjusted to the 2000 U.S. standard population using two age groups: 40-59 and 60 and over.
- Importance: People diagnosed with diabetes are often at higher risk for cardiovascular conditions, such as high blood pressure. Having these conditions in combination with diagnosed diabetes increases the likelihood of complications, such as heart and kidney diseases, blindness, nerve damage, and stroke. Patients who manage their diagnosed diabetes and maintain an HbA1c level <8% and blood pressure <140/80 mm Hg can decrease these risks.
- Overall Rate: In 2011-2012, among adults age 40 and over with diagnosed diabetes, 69.2% achieved HbA1c less than 8% and 68.5% achieved blood pressure less than 140/80 mm Hg.
- Groups With Disparities:
- In 2003-2006, Blacks and Mexican Americans were less likely than Whites to have their HbA1c under control. Differences in 2007-2010 and 2011-2012 were not statistically significant.
- In 2007-2010 and 2011-2012, Blacks were less likely than Whites to have their blood pressure under control.
Outcomes of Diabetes Care for Blacks
| Measure | Most Recent Disparity | Disparity Change |
|---|---|---|
| Admissions for uncontrolled diabetes without complications per 100,000 population, age 18 and over | Worse | No Change |
| Admissions with diabetes with short-term complications per 100,000 population, age 18 and over | Worse | Narrowing |
| Admissions with diabetes with short-term complications per 100,000 population, ages 6-17 | Worse | No Change |
| Admissions with diabetes with long-term complications per 100,000 population, age 18 and over | Worse | No Change |
| Adjusted incident rates of end stage renal disease (ESRD) due to diabetes per million population | Worse | Narrowing |
- Trends: Less than half of outcomes of diabetes care for Blacks were improving.
- Groups With Disparities:
- Blacks had higher rates of admission than Whites for uncontrolled diabetes and for long-term complications of diabetes. These disparities did not change over time.
- Black adults had higher rates of admission than Whites for admission for short-term complications of diabetes but the disparity was narrowing over time.
- Black children had higher rates of admission for short-term complications than White children and this disparity was not changing over time.
- Blacks had higher rates of ESRD due to diabetes than Whites and this disparity was narrowing over time.
Hospital Admissions for Uncontrolled Diabetes Without Complications
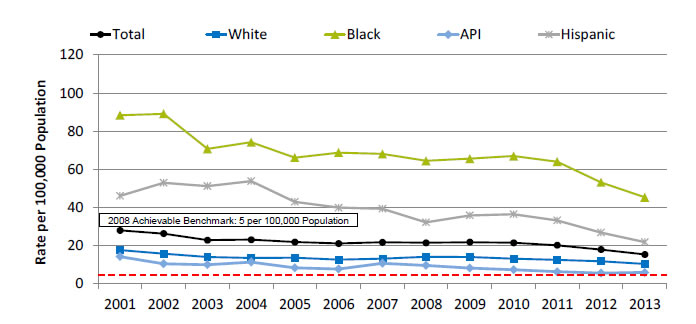
Hospital admissions for uncontrolled diabetes without complications per 100,000 population, age 18 and over, by race/ethnicity, 2001-2013
| Race/Ethnicity | 2001 | 2002 | 2003 | 2004 | 2005 | 2006 | 2007 | 2008 | 2009 | 2010 | 2011 | 2012 | 2013 |
|---|---|---|---|---|---|---|---|---|---|---|---|---|---|
| Total | 27.9 | 26.2 | 22.8 | 23.1 | 21.8 | 21.1 | 21.7 | 21.4 | 21.7 | 21.4 | 20.1 | 17.9 | 15.4 |
| White | 17.6 | 15.8 | 14.0 | 13.5 | 13.6 | 12.6 | 13.2 | 14.1 | 14.0 | 13.1 | 12.4 | 11.7 | 10.3 |
| Black | 88.3 | 89.1 | 70.6 | 74.2 | 66.1 | 68.7 | 68.1 | 64.4 | 65.5 | 66.9 | 64.0 | 53.1 | 45.3 |
| API | 14.2 | 10.4 | 9.9 | 11.3 | 8.3 | 7.7 | 10.6 | 9.6 | 8.2 | 7.3 | 6.2 | 5.5 | 5.9 |
| Hispanic | 46.0 | 52.9 | 51.1 | 53.8 | 42.9 | 39.8 | 39.3 | 32.2 | 35.8 | 36.4 | 33.1 | 26.7 | 21.7 |
2008 Achievable Benchmark: 5 per 100,000 Population.
Key: API = Asian or Pacific Islander.
Source: Agency for Healthcare Research and Quality, Healthcare Cost and Utilization Project, State Inpatient Databases, 2001‐2013 quality and disparities analysis files and AHRQ Quality Indicators, modified version 4.4.
Denominator: U.S. resident population age 18 and over.
Note: For this measure, lower rates are better. Rates are adjusted by age and gender using the total U.S. resident population for 2010 as the standard population; when reporting is by age, the adjustment is by gender only.
- Importance:
- Individuals who do not achieve good control of their diabetes may develop symptoms that require correction through hospitalization.
- Admission rates for uncontrolled diabetes may be reduced by better outpatient treatment and patients’ tighter adherence to the recommended diet and medication.
- Trends:
- The rate of hospital admissions for uncontrolled diabetes without complications per 100,000 population decreased from 27.2 in 2001 to 15.4 in 2013.
- From 2001 to 2013, the rate of hospital admissions per 100,000 population decreased for all populations:
- For Blacks, from 88.3 to 45.3.
- For Whites, from 17.6 to 10.3.
- For APIs, from 14.2 to 5.9.
- For Hispanics, from 46.0 to 21.7.
- Groups With Disparities: In all years, the rate of hospital admissions for uncontrolled diabetes was higher for Blacks and Hispanics compared with Whites.
- Achievable Benchmark:
- The 2008 top 4 State achievable benchmark was 5 admissions per 100,000 population age 18 and over. The top 4 States that contributed to the achievable benchmark are Colorado, Hawaii, Utah, and Vermont.
- At the current rate, the benchmark could not be met for the total population for approximately 16 years.
- At the current rates, both Whites and Blacks would need 15 years to reach the benchmark. Hispanics could reach the benchmark in less than 8 years and APIs in less than 3 years.
Hospital Admissions for Uncontrolled Diabetes Without Complications, Stratified by Income
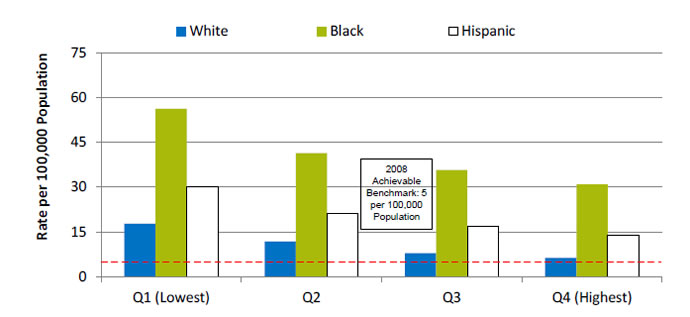
Hospital admissions for uncontrolled diabetes without complications per 100,000 population, age 18 and over, by race/ethnicity stratified by income, 2013
| Quartile | White | Black | Hispanic |
|---|---|---|---|
| Q1 (Lowest) | 17.7 | 56.2 | 30 |
| Q2 | 11.8 | 41.4 | 21.3 |
| Q3 | 7.9 | 35.7 | 16.8 |
| Q4 (Highest) | 6.3 | 30.9 | 13.9 |
2008 Achievable Benchmark: 5 per 100,000 Population.
Key: Q1 represents the lowest income quartile and Q4 represents the highest income quartile based on the median income of a patient's ZIP Code of residence.
Source: Agency for Healthcare Research and Quality, Healthcare Cost and Utilization Project, State Inpatient Databases, 2013 quality and disparities analysis file and AHRQ Quality Indicators, modified version 4.4.
Denominator: U.S. resident population age 18 and over.
Note: For this measure, lower rates are better.
Rates are adjusted by age and gender using the total U.S. resident population for 2010 as the standard population; when reporting is by age, the adjustment is by gender only; when reporting is by gender, the adjustment is by age only.
- Importance:
- Individuals who do not achieve good control of their diabetes may develop symptoms that require correction through hospitalization.
- Admission rates for uncontrolled diabetes may be reduced by better outpatient treatment and patients’ tighter adherence to the recommended diet and medication.
- Groups With Disparities: The rate of hospital admissions for uncontrolled diabetes was higher for Blacks in the highest income quartile compared with Whites in the lowest income quartile.
- Achievable Benchmark:
- The 2008 top 4 State achievable benchmark was 5 admissions per 100,000 population age 18 and over. The top 4 States that contributed to the achievable benchmark are Colorado, Hawaii, Utah, and Vermont.
- No group has reached the benchmark.
New Cases of End Stage Renal Disease Due to Diabetes
New cases of end stage renal disease due to diabetes, per million population, by ethnicity, 2003-2013
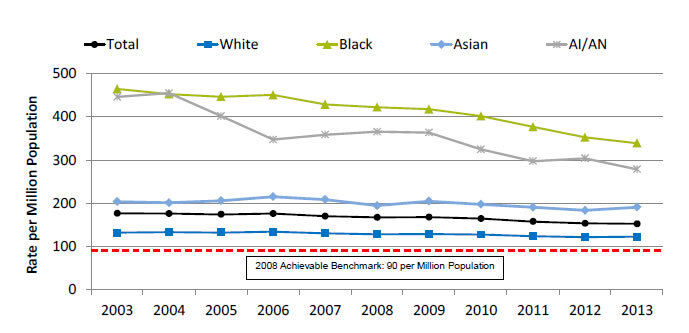
| Ethnicity | 2003 | 2004 | 2005 | 2006 | 2007 | 2008 | 2009 | 2010 | 2011 | 2012 | 2013 |
|---|---|---|---|---|---|---|---|---|---|---|---|
| Total | 176.4 | 175.8 | 174.1 | 175.9 | 169.8 | 167.4 | 167.7 | 164.4 | 157.5 | 153.4 | 152.4 |
| Black | 464.2 | 452.5 | 446.5 | 450.6 | 428.6 | 422.2 | 417.7 | 401.4 | 376.5 | 352.6 | 338.9 |
| White | 132.0 | 133.3 | 132.2 | 134.0 | 130.1 | 128.0 | 128.8 | 127.7 | 123.4 | 121.7 | 122.6 |
| AI/AN | 445.8 | 454.6 | 401.6 | 347.0 | 358.4 | 365.3 | 363.5 | 324.5 | 297.1 | 303.8 | 278.5 |
| Asian | 203.6 | 200.9 | 205.7 | 215.1 | 208.5 | 194.3 | 204.6 | 197.5 | 190.5 | 183.3 | 190.9 |
2008 Achievable Benchmark: 90 per Million Population.
Key: AI/AN = American Indian or Alaska Native.
Source: National Institute of Diabetes and Digestive and Kidney Diseases, U.S. Renal Data System, 2003-2013.
Denominator: U.S. resident population.
Note: For this measure, lower rates are better. Rates are adjusted by age, sex, and interactions of age and sex. Adjusted rates use the 2011 ESRD cohort as reference.
- Importance: Diabetes is the most common cause of kidney failure. Keeping blood glucose levels under control can prevent or slow the progression of kidney disease. When kidney disease is detected early, medication can slow the disease’s progress; when detected late, it commonly progresses to end stage renal disease requiring dialysis or kidney transplantation. While some cases of kidney failure due to diabetes cannot be avoided, other cases reflect inadequate control of blood glucose or delayed detection and treatment of early kidney disease due to diabetes.
- Trends: From 2003 to 2013, the overall rate of new cases of ESRD due to diabetes decreased for Blacks.
- Groups With Disparities: In all years, Blacks had higher rates than Whites.
- Achievable Benchmark:
- The 2008 top 5 State achievable benchmark was 90 per million population. The top 5 States that contributed to the achievable benchmark are Alaska, Maine, New Hampshire, Rhode Island, and Vermont.
- At current rates of change, the benchmark would not be achieved overall or by any racial group for decades.
AHRQ Health Care Innovations in Diabetes Care
- Population: Low-income, rural Black patients with diabetes.
- Location: Eastern North Carolina.
- Intervention: Based on a patient-centered medical home model and supported by a common electronic health record and diabetes registry, this intervention features a team of certified diabetes educators who regularly visit clinics to provide comprehensive, culturally tailored patient education during primary care visits.
- Outcomes: Improved glycemic control, lipids, and blood pressure in Black patients with diabetes from medically underserved communities. Also, potentially saves money by reducing inpatient admission and emergency department visits.


