Poor Communication With Health Providers: Adults
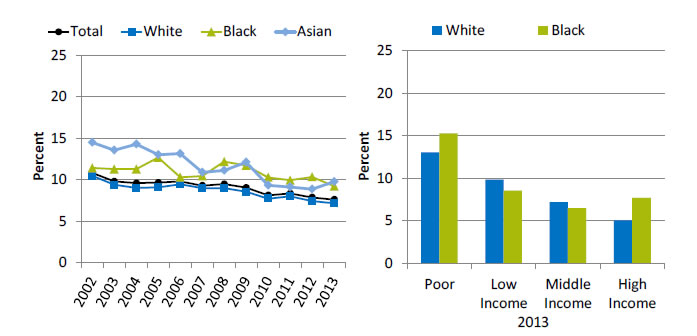
Adults who had a doctor's office or clinic visit in the last 12 months who reported poor communication with health providers, by race, 2002-2013, and stratified by income, Blacks and Whites, 2013
Left Chart:
| Race | 2002 | 2003 | 2004 | 2005 | 2006 | 2007 | 2008 | 2009 | 2010 | 2011 | 2012 | 2013 |
|---|---|---|---|---|---|---|---|---|---|---|---|---|
| Total | 10.8 | 9.8 | 9.6 | 9.7 | 9.8 | 9.3 | 9.5 | 9.0 | 8.1 | 8.3 | 7.9 | 7.6 |
| White | 10.4 | 9.4 | 9.0 | 9.1 | 9.5 | 9.0 | 9.0 | 8.5 | 7.7 | 8.0 | 7.4 | 7.2 |
| Black | 11.4 | 11.3 | 11.3 | 12.7 | 10.3 | 10.4 | 12.2 | 11.7 | 10.3 | 9.9 | 10.3 | 9.2 |
| Asian | 14.5 | 13.5 | 14.3 | 13.0 | 13.1 | 10.9 | 11.1 | 12.1 | 9.3 | 9.1 | 8.9 | 9.7 |
Right Chart:
| Income | Black | White |
|---|---|---|
| Poor | 15.3 | 13.0 |
| Low Income | 8.6 | 9.8 |
| Middle Income | 6.5 | 7.2 |
| High Income | 7.7 | 5.1 |
Source: Agency for Healthcare Research and Quality, Medical Expenditure Panel Survey, 2002-2013.
Denominator: Civilian noninstitutionalized population age 18 and over who had a doctor’s office or clinic visit in the last 12 months.
Note: For this measure, lower rates are better. Patients who report that their health providers sometimes or never listened carefully, explained things clearly, showed respect for what they had to say, or spent enough time with them are considered to have poor communication. Poor refers to family income below 100% of the Federal poverty level (FPL); low income refers to income of 100% to 199% of the FPL; middle income refers to income of 200% to 399% of the FPL; and high income refers to income of 400% of the FPL and above. These are based on U.S. census poverty thresholds.
- Importance: Optimal health care requires good communication between patients and providers, yet barriers to provider-patient communication are common. To provide all patients with the best possible care, providers need to understand patients’ diverse health care needs and preferences and communicate clearly with patients about their care.
- Trends: From 2002 to 2013, the percentage of adults who reported poor communication with health providers significantly decreased overall and for Blacks, Whites and Asians.
- Groups With Disparities:
- In all years except 2006, Blacks were significantly more likely than Whites to have poor communication with their health providers.
- In 2013, high-income Blacks were more likely than high-income Whites to have poor communication with their health providers. Differences among other income groups were not statistically significant.
Poor Communication With Health Providers: Children
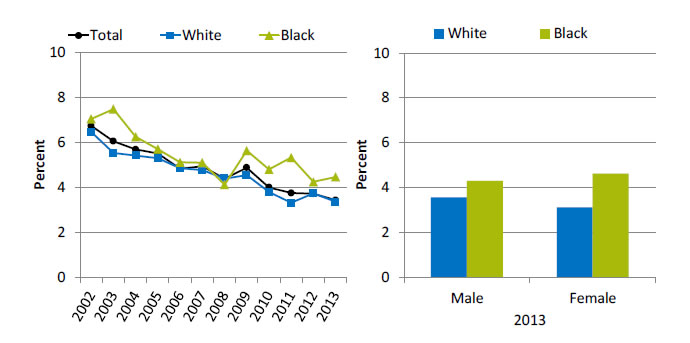
Children who had a doctor's office or clinic visit in the last 12 months whose parents reported poor communication with health providers, by race, 2002-2013, and stratified by sex, Blacks and Whites, 2013
Left Chart:
| Race | 2002 | 2003 | 2004 | 2005 | 2006 | 2007 | 2008 | 2009 | 2010 | 2011 | 2012 | 2013 |
|---|---|---|---|---|---|---|---|---|---|---|---|---|
| Total | 6.7 | 6.1 | 5.7 | 5.5 | 4.8 | 4.9 | 4.4 | 4.9 | 4.0 | 3.8 | 3.7 | 3.4 |
| White | 6.5 | 5.5 | 5.4 | 5.3 | 4.9 | 4.8 | 4.4 | 4.6 | 3.8 | 3.3 | 3.7 | 3.4 |
| Black | 7.1 | 7.5 | 6.3 | 5.7 | 5.1 | 5.1 | 4.1 | 5.6 | 4.8 | 5.3 | 4.3 | 4.5 |
Right Chart:
| Sex | Black | White |
|---|---|---|
| Male | 4.3 | 3.6 |
| Female | 4.6 | 3.1 |
Source: Agency for Healthcare Research and Quality, Medical Expenditure Panel Survey, 2002-2013.
Note: For this measure, lower rates are better. Parents who report that their child’s health providers sometimes or never listened carefully, explained things clearly, showed respect for what they had to say, or spent enough time with them are considered to have poor communication.
- Trends: From 2002 to 2013, the percentage of children whose parents reported poor communication with health providers significantly decreased for Whites and Blacks.
- Groups With Disparities:
- In 2013, parents of Black children were significantly more likely to report poor communication compared with parents of White children.
- Parents of Black girls were significantly more likely to report poor communication compared with parents of White girls. Differences among boys were not statistically significant.
Provider-Patient Communication Among Home Health Care Patients
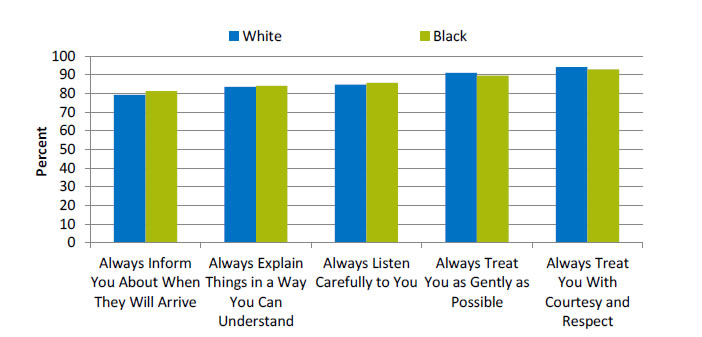
Provider-patient communication among adults receiving home health care, by race, 2014
| Race | Always Inform You About When They Will Arrive | Always Explain Things in a Way You Can Understand | Always Listen Carefully to You | Always Treat You as Gently as Possible | Always Treat You With Courtesy and Respect |
|---|---|---|---|---|---|
| Black | 81.2 | 84.1 | 85.6 | 89.6 | 92.9 |
| White | 79.2 | 83.5 | 84.7 | 91.0 | 94.1 |
Source: Centers for Medicare & Medicaid Services, Home Health Care CAHPS (Consumer Assessment of Healthcare Providers and Systems), 2014.
Denominator: Adults who had at least two visits from a Medicare-certified home health agency during a 2-month look-back period.
Note: Patients receiving hospice care and those who had “maternity” as the primary reason for receiving home health care are excluded.
- Importance: Communication between providers and patients is an important element of patient outcomes. The Consumer Assessment of Healthcare Providers and Systems (CAHPS®) Home Health Care Survey (Home Health Care CAHPS Survey) was designed to measure the experiences of people receiving home health care from Medicare-certified home health care agencies. In April 2012, the Centers for Medicare & Medicaid Services began publicly reporting results from this survey on Home Health Compare to create incentives for home health agencies to improve quality of care and to provide patients with information to help them choose home health care providers.
- Overall Rate: In 2014, among adult home health care patients, about 80% reported that home health care providers always informed them about when they would arrive, always explained things in a way they could understand, and always listened carefully to them. About 90% reported that home health care providers always treated them as gently as possible and with courtesy and respect (data not shown).
- Groups With Disparities: In 2014, among home health care patients:
- Blacks were less likely than Whites to always be treated as gently as possible.
- Blacks were less likely to always be treated with courtesy and respect.
Providers Asking for Patient’s Help To Make Treatment Decisions
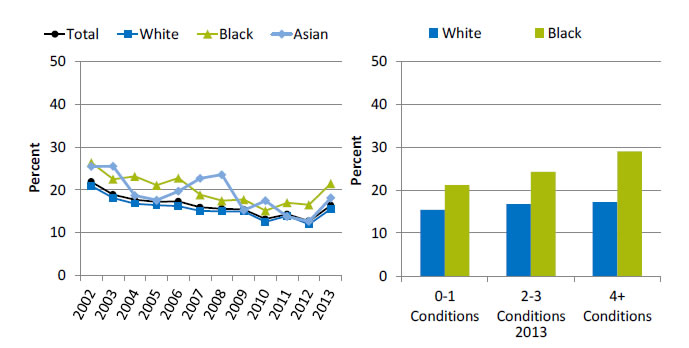
People with a usual source of care whose health providers sometimes or never asked for the patient's help to make treatment decisions, by race, 2002-2013, and stratified by number of chronic conditions, Blacks and Whites, 2013
Left Chart:
| Race | 2002 | 2003 | 2004 | 2005 | 2006 | 2007 | 2008 | 2009 | 2010 | 2011 | 2012 | 2013 |
|---|---|---|---|---|---|---|---|---|---|---|---|---|
| Total | 21.9 | 18.9 | 17.7 | 17.2 | 17.3 | 15.9 | 15.6 | 15.4 | 13.2 | 14.3 | 12.7 | 16.4 |
| White | 21.0 | 18.1 | 16.8 | 16.4 | 16.2 | 15.1 | 15.0 | 15.0 | 12.6 | 13.9 | 12.0 | 15.5 |
| Black | 26.4 | 22.5 | 23.2 | 21.1 | 22.8 | 18.9 | 17.5 | 17.7 | 15.1 | 17.0 | 16.5 | 21.5 |
| Asian | 25.5 | 25.6 | 18.7 | 17.6 | 19.7 | 22.7 | 23.6 | 15.2 | 17.5 | 13.7 | 12.7 | 18.1 |
Right Chart:
| Chronic Conditions | Black | White |
|---|---|---|
| 0-1 Conditions | 21.2 | 15.4 |
| 2-3 Conditions | 24.3 | 16.7 |
| 4+ Conditions | 29.0 | 17.2 |
Source: Agency for Healthcare Research and Quality, Medical Expenditure Panel Survey, 2002-2013.
Note: For this measure, lower rates are better. Number of chronic conditions is assessed for adults age 18 and over. MEPS title for this measure: People with a usual source of care who sometimes or never asked person to help make decisions when there was a choice between treatments. The chronic condition classification list created by Hwang and colleagues is included in the references (Hwang, et al., 2001).
- Importance: The increasing prevalence of chronic diseases has placed more responsibility on patients, since conditions such as diabetes and hypertension require self-management. Patients need to be provided with information that allows them to make educated decisions and feel engaged in their treatment. Treatment plans also need to incorporate their values and preferences.
- Trends:
- From 2008 to 2013, the percentage of people whose providers sometimes or never asked for their help with treatment decisions decreased overall from 21.9% to 16.4%.
- Improvement was observed for Whites, Blacks, and Asians.
- Groups With Disparities:
- In all years except 2008, Blacks were significantly more likely to have a usual source of care who sometimes or never asked them to help make treatment decisions.
- In 2013, among all groups defined by number of chronic conditions, the percentage of people whose providers sometimes or never asked for their help with treatment decisions was higher for Blacks than for Whites.
Help for Hospice Patients for Feelings of Anxiety or Sadness
Hospice patients who received the right amount of help for feelings of anxiety or sadness, by race, 2008-2014
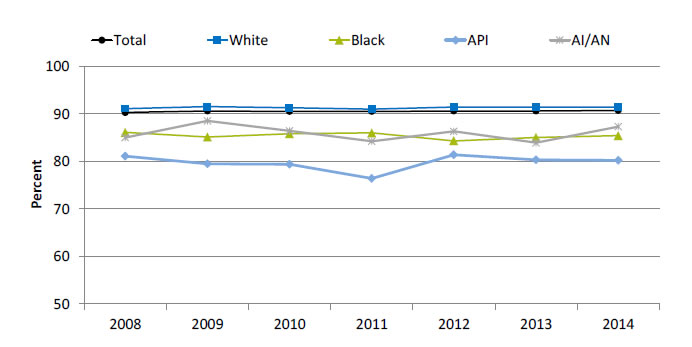
| Race | 2008 | 2009 | 2010 | 2011 | 2012 | 2013 | 2014 |
|---|---|---|---|---|---|---|---|
| Total | 90.3 | 90.6 | 90.5 | 90.5 | 90.6 | 90.6 | 90.7 |
| AI/AN | 85 | 88.5 | 86.4 | 84.2 | 86.3 | 83.9 | 87.3 |
| API | 81.1 | 79.5 | 79.4 | 76.4 | 81.4 | 80.3 | 80.2 |
| Black | 86.1 | 85.1 | 85.8 | 86 | 84.3 | 85 | 85.4 |
| White | 91.1 | 91.5 | 91.3 | 91 | 91.4 | 91.4 | 91.4 |
Key: API = Asian or Pacific Islander; AI/AN = American Indian or Alaska Native.
Source: National Hospice and Palliative Care Organization, Family Evaluation of Hospice Care Survey, 2008-2014.
- Importance: Hospice care includes practical, psychosocial, and spiritual support for the patient and family.
- Overall Rate: In 2014, 90.7% of hospice patients received the right amount of help for feelings of anxiety or sadness.
- Trends: From 2008 to 2014, there were no statistically significant changes in the percentage of hospice patients who received the right amount of help for feelings of anxiety or sadness overall or for any racial groups.
- Groups With Disparities: In 2014, compared with Whites, Blacks (85.4%), Asians and Pacific Islanders (APIs) (80.2%), and American Indians and Alaska Natives (AI/ANs) (87.3%) were significantly less likely to receive the right amount of help for feelings of anxiety or sadness.
Hospice Patient Care Consistent With Their End-of-Life Wishes
Hospice patients who received care consistent with their stated end-of-life wishes, by race, 2008-2014
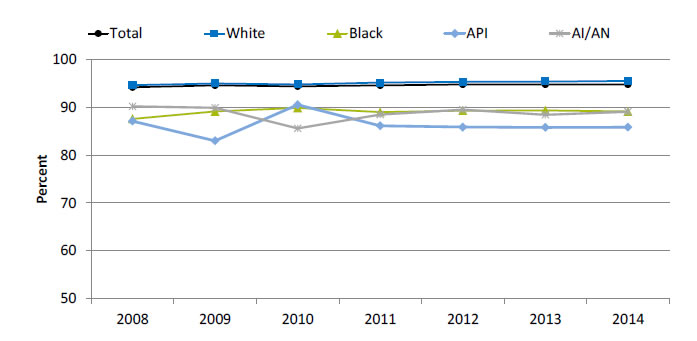
| Race | 2008 | 2009 | 2010 | 2011 | 2012 | 2013 | 2014 |
|---|---|---|---|---|---|---|---|
| Total | 94.2 | 94.6 | 94.4 | 94.6 | 94.8 | 94.8 | 94.8 |
| White | 94.7 | 95.0 | 94.8 | 95.2 | 95.3 | 95.4 | 95.6 |
| Black | 87.6 | 89.1 | 89.9 | 89.0 | 89.3 | 89.4 | 89.1 |
| API | 87.1 | 83.0 | 90.6 | 86.2 | 85.9 | 85.8 | 85.8 |
| AI/AN | 90.2 | 89.9 | 85.6 | 88.5 | 89.5 | 88.5 | 89.1 |
Key: API = Asian or Pacific Islander; AI/AN = American Indian or Alaska Native.
Source: National Hospice and Palliative Care Organization, Family Evaluation of Hospice Care Survey, 2008-2014.
- Importance: The goal of end-of-life care is to achieve a "good death," defined by the Institute of Medicine as “free from avoidable distress and suffering for patients, families, and caregivers; in general accord with the patients' and families' wishes; and reasonably consistent with clinical, cultural, and ethical standards” (Field & Cassell, 1997).
- Overall Rate: In 2014, the percentage of hospice patients who received care consistent with their stated end-of-life wishes was 94.8%.
- Trends: From 2008 to 2014, the percentage of hospice patients who received care consistent with their stated end-of-life wishes improved overall and for White hospice patients. There were no statistically significant changes among Black, API, or AI/AN hospice patients.
- Groups With Disparities: In 2014, Black, API, and AI/AN hospice patients were significantly less likely than White hospice patients to receive care consistent with their stated end-of-life wishes.
AHRQ Health Care Innovations in Person-Centered Care
The AIDS Foundation of Chicago
- Location: Chicago, Illinois.
- Population: Young Black gay and bisexual men.
- Intervention: The AIDS foundation of Chicago develops community testing programs and partners with 11 medical homes to provide real-time linkages to care for newly diagnosed HIV patients.
- Outcomes: Enhanced access to testing for hard-to-reach populations, nearly doubled the percentage of newly diagnosed HIV patients linked to care, and generated high levels of patient satisfaction.
Return to Contents
Return to National Quality Strategy Priorities


