- Thirty years ago, the Heckler Report found that:
- Overall age-adjusted cancer incidence rates for Blacks were higher than for Whites or minorities. Specific sites of excess incidence among Blacks were the stomach, prostate, esophagus, pancreas, and cervix.
- The overall 5-year relative survival rate of Blacks was lower than that of Whites.
- In addition, quality care for cancer has changed. Evidence-based mass screening is recommended in specific populations for four cancers: breast, cervical, colorectal, and lung cancer. Screening is the first step in the process of cancer prevention (Pap testing for cervical and colonoscopy for colorectal) and early detection (mammography for breast and CT scan for lung) in the process of cancer control. Thus, cancers amenable to screening are included in this chartbook.
Breast Cancer Care for Blacks
| Measure | Most Recent Disparity | Disparity Change |
|---|---|---|
| Women ages 50-74 who received a mammogram in the last 2 years | Same | No Change |
| Breast cancer diagnosed at advanced stage per 100,000 women age 40+ | Worse | Growing |
| Women with clinical Stage I-IIb breast cancer who received axillary node dissection or sentinel lymph node biopsy at the time of surgery | Same | No Change |
| Women under age 70 treated for breast cancer with breast-conserving surgery who received radiation therapy to the breast within 1 year of diagnosis | Same | Narrowing |
| Breast cancer deaths per 100,000 female population per year | Worse | No Change |
- Trends: Most measures of breast cancer care for Blacks were improving.
- Groups With Disparities:
- Rates of mammography were similar between Black and White women. This disparity did not change over time.
- Rates of diagnosis with advanced stage breast cancer were worse for Blacks compared with Whites and these disparities worsened over time.
- Rates of women with clinical Stage I-IIb breast cancer who received axillary node dissection at time of surgery were similar between Black and White women. This disparity did not change over time.
- Rates of women who received radiation therapy after breast-conserving surgery were similar between Black and White women, and this disparity narrowed over time.
- Breast cancer death rates were worse for Blacks compared with Whites. This disparity did not change over time.
Breast Cancer Surgery and Radiation
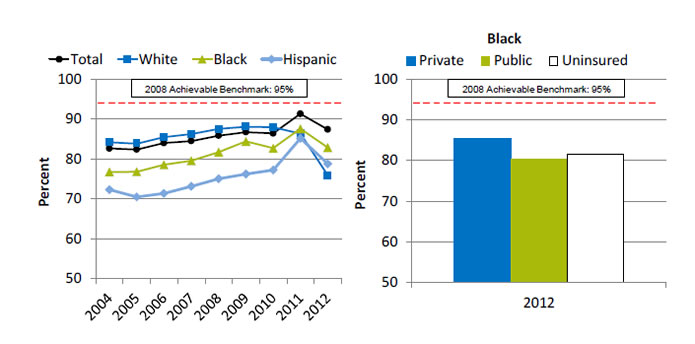
Women under age 70 treated for breast cancer with breast-conserving surgery who received radiation therapy to the breast within 1 year of diagnosis, by race/ethnicity, 2004-2012, and by insurance, Blacks under age 65, 2012

Left Chart:
| Race/Ethnicity | 2004 | 2005 | 2006 | 2007 | 2008 | 2009 | 2010 | 2011 | 2012 |
|---|---|---|---|---|---|---|---|---|---|
| Total | 82.6 | 82.4 | 84.0 | 84.5 | 85.9 | 86.7 | 86.4 | 91.3 | 87.4 |
| White | 84.2 | 83.8 | 85.5 | 86.2 | 87.6 | 88.1 | 88.0 | 86.4 | 75.8 |
| Black | 76.7 | 76.8 | 78.6 | 79.6 | 81.7 | 84.4 | 82.7 | 87.6 | 82.8 |
| Hispanic | 72.3 | 70.5 | 71.4 | 73.2 | 75.1 | 76.2 | 77.2 | 85.2 | 78.8 |
Right Chart (Insurance, Blacks under age 65, 2012):
- Private - 85.3.
- Public - 80.3.
- Uninsured - 81.4
2008 Achievable Benchmark: 95%.
Source: Commission on Cancer, American College of Surgeons and American Cancer Society, National Cancer Data Base, 2004-2012.
Denominator: Women under age 70 treated for breast cancer with breast-conserving surgery.
Note: Black and White are non-Hispanic. Hispanic includes all races.
- Importance: Radiation therapy after breast-conserving surgery reduces the risk of cancer recurrence and death.
- Trends: From 2004 to 2011, the percentage of women with breast-conserving surgery who received radiation therapy to the breast improved overall and for Blacks and Hispanics.
- Groups With Disparities:
- In 7 of 9 years, Black and Hispanic women were less likely to receive radiation therapy to the breast compared with White women.
- In 2012, Black women with public insurance (80.3%) were less likely than those with private insurance (85.3%) to receive radiation therapy to the breast.
- Achievable Benchmark:
- The 2008 top 5 State achievable benchmark was 95%. The top 5 States that contributed to the achievable benchmark are Kansas, Minnesota, Montana, New Hampshire, and Wisconsin.
- At the current rates of improvement, the benchmark could be achieved overall within 9 years.
- At the current rates of improvement, Blacks and Hispanics would need 11 and 12 years, respectively, to reach the benchmark. Whites are moving away from the benchmark.
Colorectal Cancer Care for Blacks
| Measure | Most Recent Disparity | Disparity Change |
|---|---|---|
| Men and women ages 50-75 who report that they had a blood stool test in the past year, sigmoidoscopy in the past 5 years and blood stool test in the past 3 years, or colonoscopy in the past 10 years | Same | No Change |
| Colorectal cancer diagnosed at advanced stage per 100,000 men and women age 50 and over | Worse | No Change |
| Patients with colon cancer who received surgical resection of colon cancer that included at least 12 lymph nodes pathologically examined | Worse | No Change |
| Colorectal cancer deaths per 100,000 population per year | Worse | No Change |
- Trends: All measures of colorectal cancer care for Blacks were improving.
- Groups With Disparities:
- Rates for colorectal cancer screening were similar between Blacks and Whites. This disparity did not change over time.
- Rates of diagnosis with advanced stage colorectal cancer, surgical resection of colon cancer that included at least 12 lymph nodes pathologically examined, and deaths due to colorectal cancer were worse for Blacks compared with Whites. These disparities were not changing over time.
Colorectal Cancer Screening
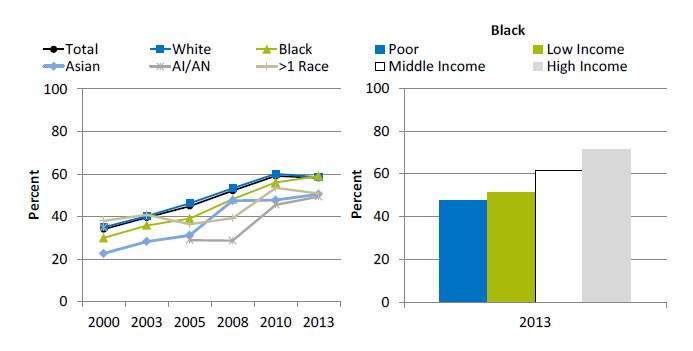
Adults ages 50-75 who report that they had appropriate colorectal cancer screening, by race, 2000-2013, and by family income, Blacks, 2013

Left Chart:
| Race | 2000 | 2003 | 2005 | 2008 | 2010 | 2013 |
|---|---|---|---|---|---|---|
| Total | 34.1 | 39.6 | 45.0 | 52.2 | 59.2 | 58.2 |
| Black | 30.0 | 35.9 | 39.1 | 48.2 | 56.1 | 59.1 |
| White | 35.1 | 40.3 | 46.3 | 53.4 | 60.2 | 58.6 |
| AI/AN | 34.9 | 29.0 | 28.7 | 45.6 | 49.4 | |
| Asian | 22.7 | 28.3 | 31.3 | 47.5 | 47.8 | 50.6 |
| >1 Race | 38.1 | 40.9 | 36.5 | 39.3 | 53.5 | 50.9 |
Right Chart (Family Income, Blacks, 2013):
- Poor - 47.6.
- Low Income - 51.5.
- Middle Income - 61.7.
- High Income - 71.6.
Key: AI/AN = American Indian or Alaska Native.
Source: Centers for Disease Control and Prevention, National Center for Health Statistics, National Health Interview Survey, 2000-2013.
Denominator: Adults ages 50-75.
Note: Measure is age adjusted. Data for AI/AN in 2003 were statistically unreliable.
- Importance: Screening can detect abnormal colorectal growths before they develop into cancer. Early detection increases treatment options and the chances for cure. Effective screening modalities include fecal occult blood testing (FOBT), FOBT with flexible sigmoidoscopy, and colonoscopy.
- Trends: From 2000 to 2013, the percentage of adults ages 50-75 who received appropriate colorectal cancer screening increased overall (from 34.1% to 58.2%) and among all racial/ethnic groups.
- Groups With Disparities:
- In 5 of 6 years, the percentage of adults who received appropriate colorectal cancer screening was lower among Asians compared with Whites.
- In 3 of 6 years, the percentage of adults who received appropriate colorectal cancer screening was lower among Blacks compared with Whites.
- In 2013, the percentage of adults who received appropriate colorectal cancer screening was lower among poor (47.6%), low-income (51.5%), and middle income (61.7%) Blacks compared with high-income Blacks (71.6%).
Surgical Resection of Colon Cancer
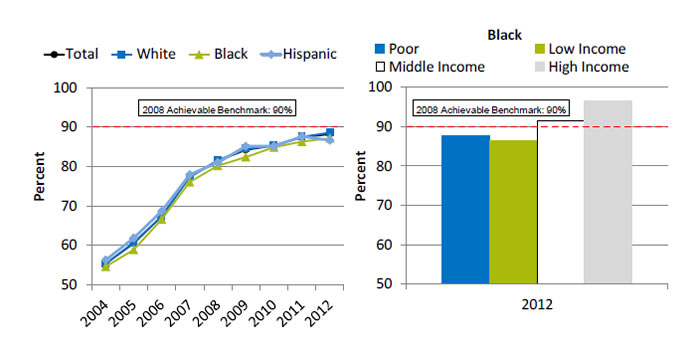
Patients with colon cancer who received surgical resection of colon cancer that included at least 12 lymph nodes pathologically examined, by race/ethnicity, 2004-2012, and by family income, Blacks, 2012

Left Chart:
| Race/Ethnicity | 2004 | 2005 | 2006 | 2007 | 2008 | 2009 | 2010 | 2011 | 2012 |
|---|---|---|---|---|---|---|---|---|---|
| Total | 55.4 | 60.5 | 67.4 | 77.4 | 81.4 | 84.2 | 85.3 | 87.4 | 88.2 |
| White | 55.3 | 60.7 | 67.3 | 77.4 | 81.6 | 84.5 | 85.4 | 87.5 | 88.6 |
| Black | 54.6 | 58.9 | 66.6 | 76.1 | 80.2 | 82.4 | 84.9 | 86.3 | 87.2 |
| Hispanic | 56.3 | 61.8 | 68.7 | 78.0 | 81.0 | 85.1 | 85.1 | 87.6 | 86.7 |
Right Chart (Family Income, Blacks, 2012):
- Poor - 87.7.
- Low Income - 86.5.
- Middle Income - 91.5.
- High Income - 96.6.
2008 Achievable Benchmark: 90%.
Source: Commission on Cancer, American College of Surgeons and American Cancer Society, National Cancer Data Base, 2004-2012.
Denominator: People with colon cancer undergoing resection of colon.
Note: Black and White are non-Hispanic. Hispanic includes all races.
- Importance: Recommended cancer treatment depends on different factors, such as the stage or extent of the cancer within the body, especially whether the disease has spread from the original site to other parts of the body. Colon cancer typically begins as a benign polyp that may become cancerous and then spread to local lymph nodes. Hence, ensuring adequate examination of lymph nodes when surgery is performed is important.
- Trends: From 2004 to 2012, the percentage of patients with colon cancer who received surgical resection of colon cancer that included at least 12 lymph nodes pathologically examined improved overall (55.4% to 88.2%) and for all racial/ethnic groups.
- Groups With Disparities:
- From 2004 to 2012, there were almost no statistically significant differences between racial/ethnic groups in the percentage of patients with colon cancer who received surgical resection of colon cancer that included at least 12 lymph nodes pathologically examined. In 2 years, Blacks were less likely than Whites to receive surgery, and in 1 year, Hispanics were less likely than Whites to receive surgery.
- In 2012, the percentage of patients with colon cancer who received surgical resection of colon cancer that included at least 12 lymph nodes pathologically examined was lower among poor (87.7%) and low-income (86.5%) Blacks compared with high-income Blacks (96.6%).
- Achievable Benchmark:
- The 2008 top 5 State achievable benchmark was 90%. The top 5 States that contributed to the achievable benchmark are Delaware, Missouri, Utah, Vermont, and Wisconsin.
- At the current rates of improvement, the achievable benchmark could be attained overall and for all racial/ethnic groups within a year.
Other Cancer Care for Blacks
| Measure | Most Recent Disparity | Disparity Change |
|---|---|---|
| All cancer deaths per 100,000 population per year | Worse | No Change |
| Women ages 21-65 who received a Pap smear in the last 3 years | Same | No Change |
| Invasive cervical cancer incidence per 100,000 women age 20 and over | Worse | Narrowing |
| Men age 75+ without prostate cancer who had a PSA test or digital rectal exam for prostate cancer screening within the past year | Same | No Change |
| Lung cancer deaths per 100,000 population per year | Same | No Change |
- Trends: Most measures of other cancer care for Blacks were improving.
- Groups With Disparities:
- Death rates were higher among Blacks compared with Whites and were not changing over time.
- Blacks were more likely to develop invasive cervical cancer compared with Whites. This disparity was narrowing over time.
- Rates among Blacks and Whites were similar for Pap smears, prostate cancer screening, and lung cancer deaths and these disparities were not changing over time.
Pap Smears
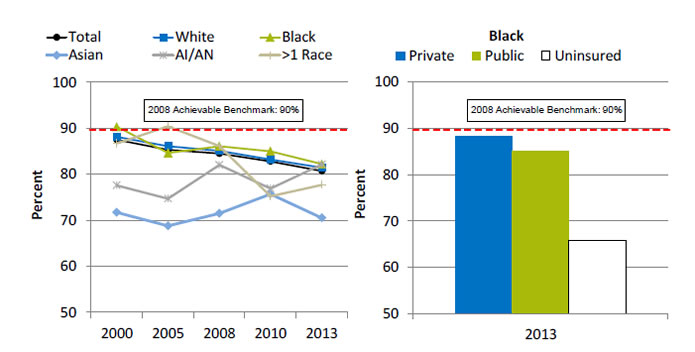
Women ages 21-65 who received a Pap smear in the last 3 years, by race, 2000-2013, and by insurance, Blacks, 2013

Left Chart:
| Race | 2000 | 2005 | 2008 | 2010 | 2013 |
|---|---|---|---|---|---|
| Total | 87.5 | 85.3 | 84.5 | 82.8 | 80.7 |
| Black | 90.3 | 84.6 | 86.1 | 85.0 | 82.2 |
| White | 88.1 | 86.1 | 85.1 | 83.2 | 81.4 |
| AI/AN | 77.6 | 74.7 | 82.0 | 76.9 | 82.1 |
| Asian | 71.7 | 68.8 | 71.5 | 75.7 | 70.5 |
| >1 Race | 86.7 | 90.4 | 86.1 | 75.2 | 77.7 |
Right Chart (Insurance, Blacks, 2013):
- Private - 88.2.
- Public - 85.0.
- Uninsured - 65.8.
2008 Achievable Benchmark: 90%.
Key: AI/AN = American Indian or Alaska Native.
Source: Centers for Disease Control and Prevention, National Center for Health Statistics, National Health Interview Survey, 2000-2013.
Denominator: Women ages 21-65.
Note: Measure is age adjusted. Racial groups refer to single race (e.g., White only).
- Importance: Screening with Pap smears can detect high-grade precancerous cervical lesions that can be removed before they become cancerous.
- Trends: From 2000 to 2013, the percentage of women ages 21-65 who received a Pap smear in the last 3 years decreased overall (87.5% to 80.7%) and for Whites (88.1% to 81.4%) and Blacks (90.3% to 82.2%).
- Groups With Disparities:
- In all years, the percentage of women who received a Pap smear was lower among Asian women compared with White women. The disparities between Asians and American Indians/Alaska Natives (AI/ANs) and Whites are narrowing. This is due to a decline in the White rates.
- In 2013, uninsured Black women (65.8%) were less likely to receive a Pap smear compared with Black women with private insurance (88.2%).
- Achievable Benchmark:
- The 2008 top 5 State achievable benchmark was 90%. The top 5 States that contributed to the achievable benchmark are Delaware, District of Columbia, Massachusetts, Rhode Island, and Vermont.
- The total and all racial/ethnic groups except AI/ANs are moving away from the achievable benchmark. AI/ANs could achieve the benchmark, although it would take 22 years.
AHRQ Health Care Innovations in Cancer Screening
Contra Costa Breast Cancer Partnership
- Location: Contra Costa County, California.
- Population: Low-income minority women, particularly Black women, age 40 and over.
- Intervention: Contra Costa Breast Cancer Partnership aimed to reduce disparities in breast cancer-related health outcomes by developing culturally appropriate outreach and education designed to reduce the stigma surrounding breast cancer, encourage screening, and secure access to affordable treatment.
- Outcomes: Enhanced access to breast cancer screening and earlier detection of breast cancer among Black and Hispanic women.


